


CM3 is your conversion KPI
Running CRO tests? Forget CVR or CTR or CPA, here's your only metric of choice.

Contribution margin 3 (CM3) is the key metric you should be considering when running CRO experiments.
CM3 is the profit leftover from a sale once you’ve taken into account COGS (inc. fulfilment), card fees, discounts, and marketing costs. It’s the only true measure of how your conversion rate experiments have taken place.
Today we’ll be exploring why it’s so important, why there’s so many common pitfalls, and how to run this measurement yourself.
Why you shouldn’t just use CVR to measure CRO experiments
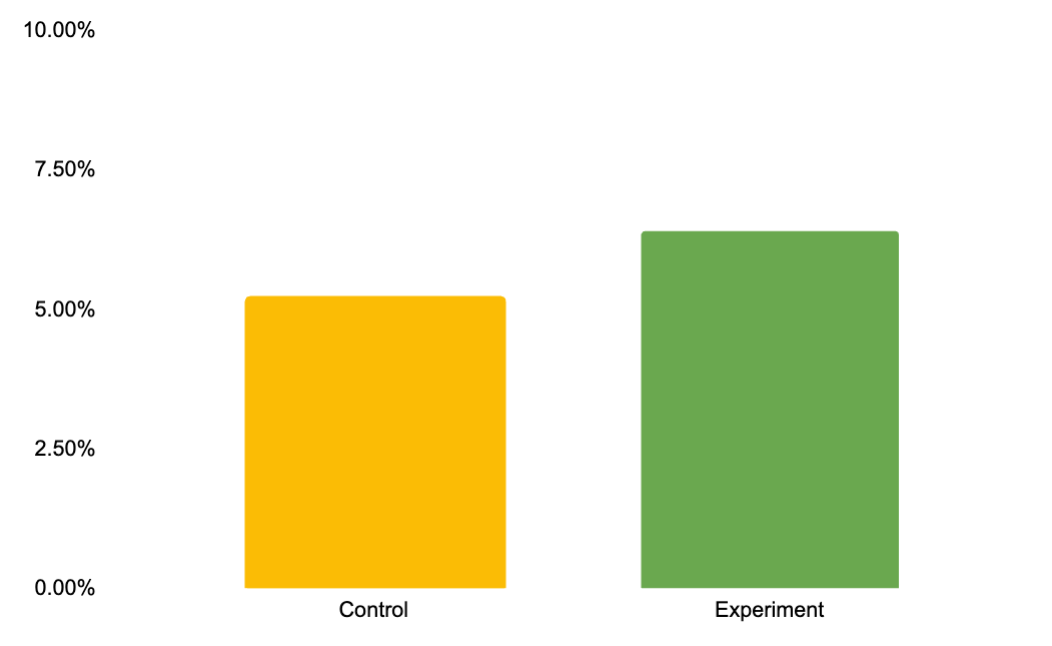
First things first, let’s imagine we complete an A/B test on a landing page and we get the following results
Control gets us 5.2% conversion rate
Experiment gets us 6.4%
Resulting? 23% improvement to conversion rate.
Happy days, right? Maybe, but also maybe not. The answer is of course, it depends.
People are funny beings. Consider how we used to display our pricing at Wine List.

Doesn’t take an investigator to recognise we ran something counter-intuitive here, we ran most expensive on the left and cheapest on the right. We had people all the time email to let us know we’d got a mistake on our pricing page, but it wasn’t a mistake, we’d tested our way there.
We had higher CM3 when running this setup compared to £12 → £39 → £99.
There was lots of behavioural science at play in this experiment:
Anchoring and priming: means we got people ready for high price and then subsequent ones felt cheaper
Decoy effect meant that the £99 option pushed more people into a £39 option
Framing meant that an extra £7 felt affordable for two more glasses of wine
Choice paradox was overcome with pre-selected a “We recommend” option
Price perception meant £39 felt like good value for money once you calculated the cost per glass in your head
Each of those biases and behaviours shifted the buying habit of the customer. Plus we all have different perception of value. For some people £99 will signal great value compared to the £39 option, whereas for others they’ll ask “why is this wine so cheap? Is the true price much lower?”
When you think about the other test, then measuring it based on conversion rate only gives you so much data.
AOV isn’t enough either
Average order value doesn’t get us much closer to the answer either.
Let’s continue with the above example.
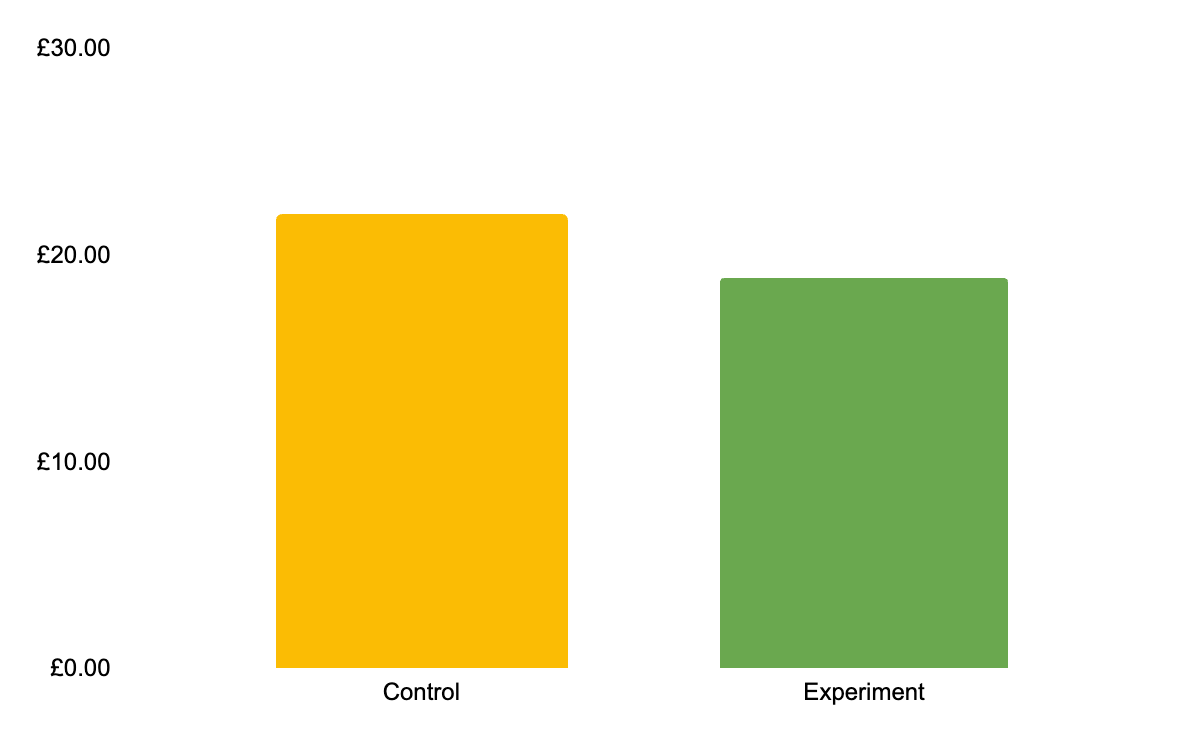
Let’s imagine the AOV now is showing that the Experiment cohort had lower AOV from the new selection. Now conversion rate is much higher, but we’re getting lower revenue amounts from people.
Looking at this stat, it’s natural to now start to be able to make judgement calls on which result might be better. You can probably even start to work out the ‘revenue per session’ which gets you a bit closer to the answer.
Common pitfall: evaluating using your margin as a %
It’s common now to say “right, we have a 62% margin, let’s just multiply these two AOVs by our 62% to get the amount of margin for each one and then calculate the right return off the back of it.
This creates an issue because your COGS likely won’t change with your CRO experiment.
Here are a few common CRO experiments:
First order discount
Shipping threshold
Free gift at certain level of spend
Change in price
Change in subscription discount
Each of these has multiple variables to it for analysis.
CM3 is one of two true ways to measure the impact of your CRO experiment – the other is LTV, which if you’re a subscription product will be more relevant.
But the LTV approach adds further complexity because user behaviour doesn’t stay fixed in isolation.
The behavioural biases that impact someone’s conversion impact their view of onboarding and retention too. So subscription products are inherently harder to measure this stuff properly with, owing to the longer tail of how LTV is produced.
How to calculate CM3 in a CRO experiment
Let’s go back to our above example, here’s all the data we need to make a judgement call:
Number of orders of each route
COGS of each route
Net revenue of each
CPA differences in each (which we can work out from the conversion rate)
That produces us this data
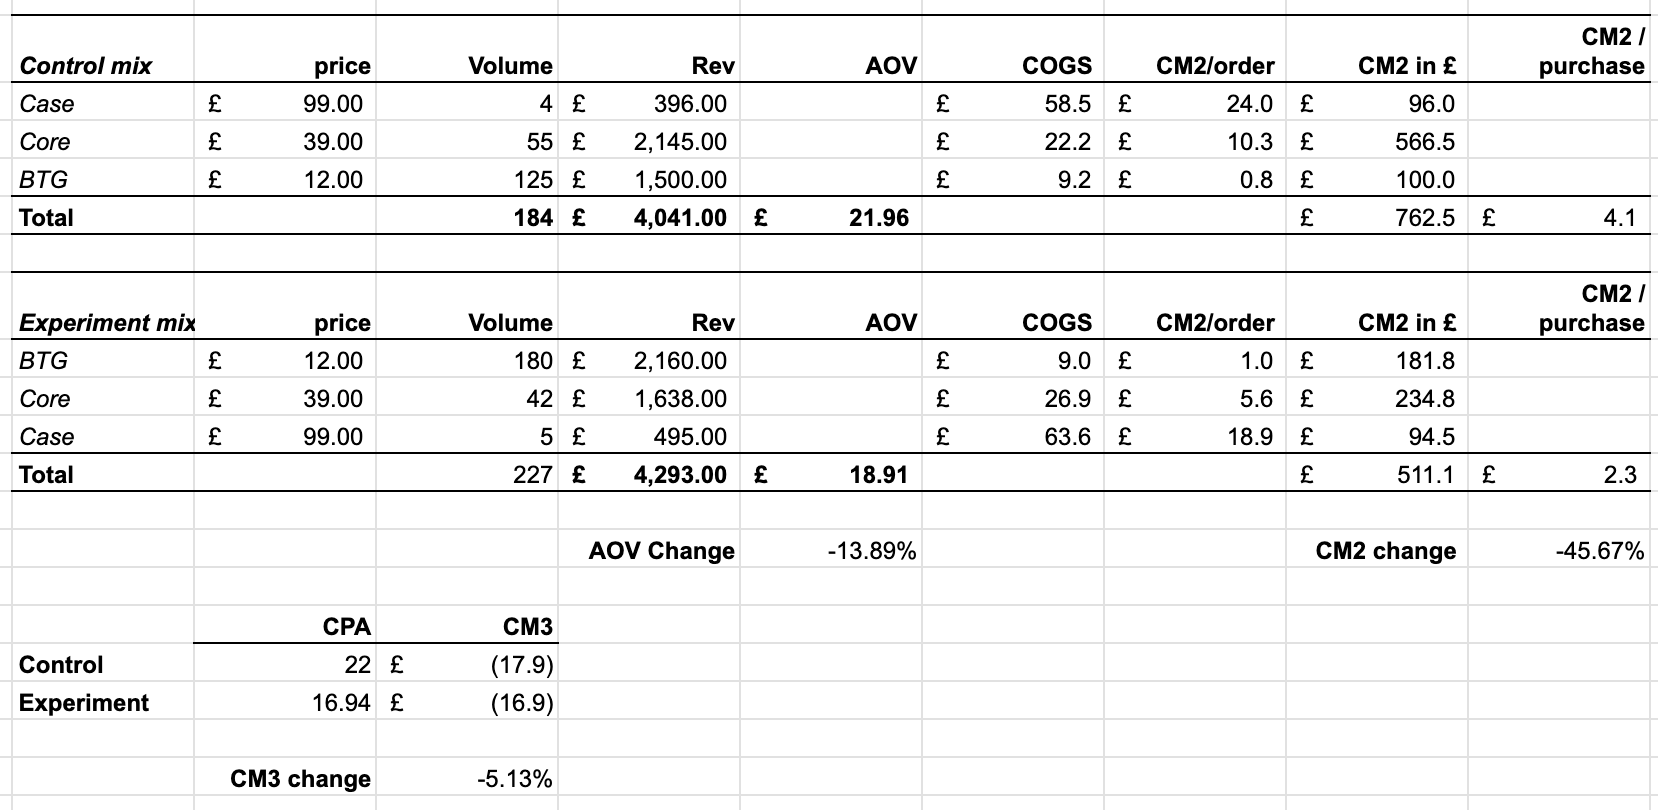
Here are those stats again:
Conversion rate is 23% higher in Experiment over Control. This also means we can assume a 23% better CPA with the experiment over control too.
AOV was 14% worse in Experiment over Control. This is due to a much higher percentage of sales going into the lowest price point tier.
Owing to the differing COGS as a % for each product, CM2 has a greater difference with experiment 46% worse than control
BUT because of that 23% improvement to CPA, the impact in CM3 terms is only 5% different.
I’ve built this as a calculator so you can play around with a simplified version in the footer.
Now as you weigh up all of these elements, you’ll notice that there can be peculiar instances where you might want to optimise towards certain product mixes over others.
Strategy dictates what the right answer is
Even with the above data, we may choose to to go after the Experiment.
Why?
Often it could be because the LTV could be higher, which this first order CM3 doesn’t reveal.
Or maybe, it’s more strategic.
All things held equal, it’s better to have more customers than fewer.
Not only that, it’s better to have more conversion data in your ad platform than less.
Lower CPA = faster learning.
Faster learning = better testing.
Better testing = more likely to scale.
Most of you reading this won’t be running or working for profitable businesses. To hit profitability requires a certain amount of CM3 pumping into the business each month that covers all your other costs. That likely requires a huge increase in spend at your current efficiency.
Now how do you get there? In my experience the confidence of low CPA is worth its weight in gold.
Ultimately the right answer comes down to strategy. Is this an optimisation play where you need to hit a certain threshold of profit margin? Or are you still a long way away from truly having a stable business, in which case there’s a strong case for more customers through the door.
This stuff isn’t easy. There’s no black and white answer, and data is only one thing to look at.
If you’re at a brick wall interpreting your data, or you’re looking to make CRO changes that can improve profitability, then we’d love to chat.
Download our CRO CM3 Calculator
