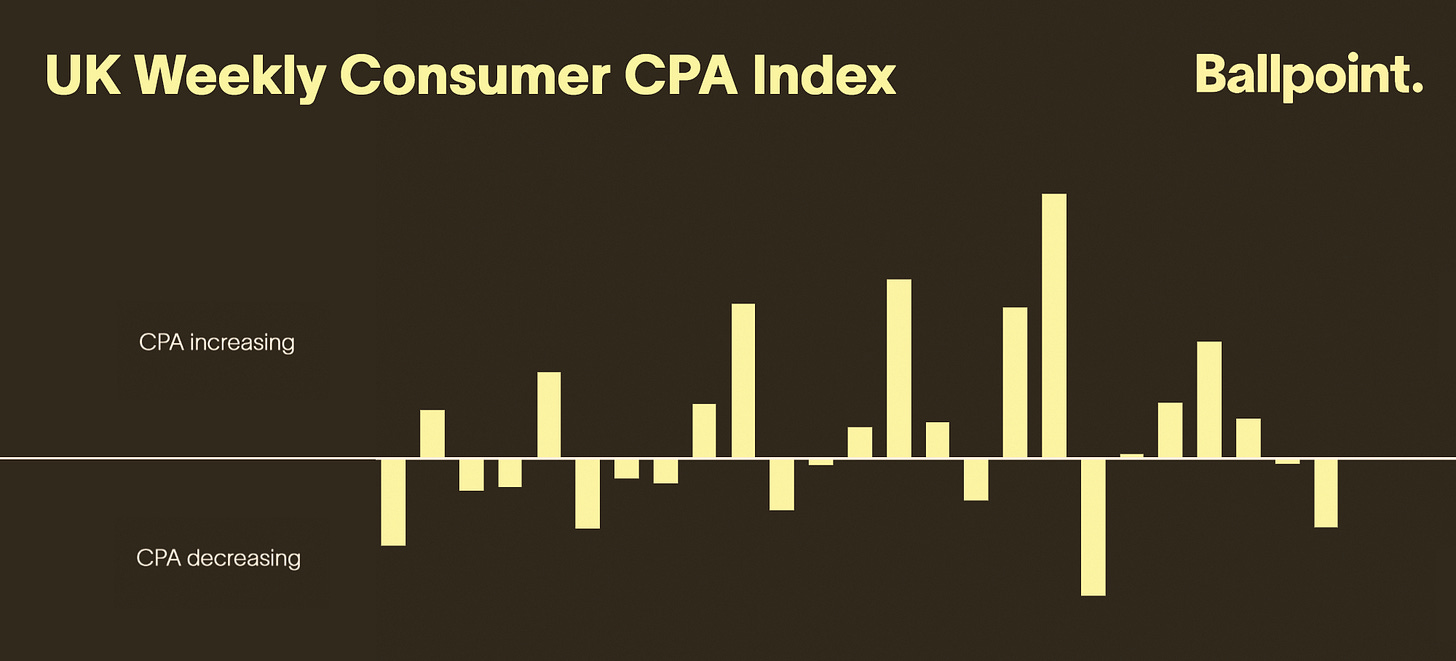
How is Facebook doing for you this week?
The question that sits front of mind for marketers, founders, and growth teams everywhere
Yesterday we launched the UK Weekly Consumer Meta CPA Index to our clients. We’re going to also run this in private beta testing to a wider audience. If you’d like to join in then let me know.
First of all you probably want to know: what is it?
What is the UK Weekly Consumer Meta CPA Index?
Last weekend I read in the FT that ‘UK retail sales had fallen to a two-year low as inflation hit consumers spending’. Retail sales were down September to October, and when compared to the previous October. If I was a retailer, I thought, that would be useful to know.
Almost every week since I’ve started advertising online, I’ve been in a conversation that asks ‘how’s Facebook going for you at the moment?’ When I was in-house and when I was a founder, this was a daily question.
What we’re really trying to ask is: ‘our performance is good/bad this week, and we want to know if that’s because of us or something external.’
The answer to this question I’ve always found to be very useful. Both outperforming and underperforming market is useful context.
Answering that question is actually more difficult than a CPA number. “My CPA was £50 yesterday” doesn’t actually help me if mine is £88. Even knowing CPA has gone up to £50 from £35, still doesn’t provide you with any context.
Each brand has their own micro factors that impact CPA: customer, strategy, product, marketing, website, experimentation, creative, media buying, CRM, weather, seasonality.
CPA is obtusely measured as a division of marketing cost by number of customers acquired. But it is in fact a product of millions of variables.
Relativity is key
It’s vital therefore that we consider CPA in relative terms to what’s going on elsewhere. How does yesterday’s CPA compare to recent ones? What about spend? These things are required to understand the answer of ‘how is Facebook performing for you?’
The Index we’ve created therefore is centred in relativity. It’s basing performance on very recent day in relation to also recent but not quite as so recent data. And then importantly it’s weighting it based on account size.
What it shows
The Index therefore shows the % change in CPA. When it goes down, it means – taking various factors into account – that the platforms was acquiring more cheaply than the week before. And when it goes up, the inverse is true.
This is very obviously a limited set of data. It’s based on mid-six figures of monthly ad spend. That said, when we’ve run some testing on this against data it seems to hold true.
Join the Index
I’d love to expand this: both in terms of data available within it, and to continue refining the methodology of it.
And so, I’d like to invite you to join the private beta. You get access to the Index, and can help shape what it shows. In exchange you have to share your data to the Index.
And if you’ve got any questions on this more broadly, then feel free to drop me a line: josh@weareballpoint.com.