
Stop reporting ROAS, focus on this instead (CALCULATOR INSIDE)
Lessons from CFOs, heads of finances, investors, and the best growth leads.


The metric most DTC brands optimise for is actively working against their growth. Here’s what to focus on instead — and a free calculator to get started.
In my first head of growth role, I reported purely on CPA. Along with ROAS, it can be one of the worst metrics in performance marketing.
I didn’t know any better. I genuinely believed we were heading towards a world where platforms would have perfect attribution: where every touchpoint in the customer journey was tracked, and some multi-touch model would assign a precise value to each part of your marketing. For most of the mid-2010s, it looked like that was exactly where things were going.
Then we started testing new channels, and the real problem with this approach became impossible to ignore.
At the time, I could hide behind the fact that measurement genuinely looked like it was heading in that direction. But I really wish I knew then what I know now.
Later, when I became a founder, I understood this problem instinctively, but never properly articulated it. And that’s the issue for most brands: the language we use to talk about performance keeps the entire business stuck in the wrong conversation.
Here’s why ROAS is the worst metric in performance marketing, and the metrics to focus on that will help you grow (and your CFO will love you for it too).
ROAS teaches you the wrong lesson
In the classic advertising sense, ROAS makes you focus on efficiency rather than effectiveness. That sounds like a subtle distinction. It isn’t. It fundamentally shapes every decision you make.
Efficiency is about minimising waste. Effectiveness is about your ability to achieve an outcome. And the strategic outcome we should all be striving for is growth.
ROAS makes you believe the goal is the most profitable return per customer acquisition. Actually, the goal is to generate more net profit for the business, and to do that you need more contribution margin, not a higher ratio.
Meta is a scale channel, not an efficiency one.
ROAS tricks you into thinking you can maintain high profit per order forever, but eventually you exhaust the low-hanging fruit. The retargeting audiences, the branded search terms, the people who were going to buy anyway. These are your easiest conversions, but they’re also the ones with the lowest incrementality. I.e., if you turned off your campaigns, you probably would have had much of the same result anyway.
Byron Sharp’s research makes this point clearly: most of a brand’s growth comes from acquiring the long tail of light buyers. It comes from people who don’t know you yet and aren’t actively searching. Reaching these people costs more per acquisition, but they represent genuine incremental growth. Incrementality research from Haus and others consistently shows the same pattern: the campaigns with the best platform-reported ROAS often have the lowest true incrementality.
Here’s the uncomfortable bit: ROAS is also easily manipulatable. I can give you brilliant ROAS tomorrow by shifting all your spend to branded search. You’ll have a few weeks of beautiful dashboards. But it won’t actually do anything for the business.
CPA sits on the other side of the same coin. It tells you what you paid per customer, but nothing about what that customer was worth, or whether the spend was genuinely incremental.
One important caveat. I’m not arguing that ROAS and CPA are useless. There are minimum thresholds you absolutely need. You should be at least breaking even, either on the first purchase or through strong repeat purchase economics. But above those thresholds, the conversation needs to shift from “how do we improve our ROAS?” to “how much profitable scale can we add while staying above our floor?”
Quick plug
I write a 7-minute read for Substack every week. We manage £20m of ad spend per year, I’ve helped grow eight consumer businesses from £0 to £10m, and have built creative engines that scale for 9-figure consumer brands. Before I ran Ballpoint, I was a DTC founder and ex-operator.
If you’d like the entire archive of our learnings, consider a paid subscription. You get:
Entire archive of this Substack
Invite to the Ballpoint Summer Party
Early access to all Ballpoint resources, reports and downloads
What to measure instead: contribution margin
If ROAS measures efficiency, contribution margin measures effectiveness. It tells you how much cash your marketing is putting into the business after the costs that actually matter.
There’s some jargon to unpick here, but it’s simpler than it sounds. Think of it as three layers.
CM1 is your product margin. Take your average order value, subtract discounts, subtract your cost of goods. This is what you’d earn on every order if nothing else existed. It’s the starting point.
CM2 is your variable margin per order. Take CM1 and subtract the other costs that come with each sale — shipping, payment processing fees, packaging. This is the real margin you earn every time someone buys, before any marketing cost.
CM3 is your margin after marketing. Take CM2 and subtract your cost per acquisition. This tells you whether your marketing is actually generating cash for the business, per customer acquired.
Two numbers matter here. CM3 as a percentage tells you what proportion of revenue survives all variable costs including acquisition. CM3 in cash terms tells you the total gross profit your marketing is generating. This second number — total contribution in pounds — deserves more of your attention. Because just as ROAS can mislead you on efficiency, a high CM3 percentage can disguise the fact that you’d make far more money at a lower percentage but higher volume.
Here’s a simple illustration.
Brand A spends £50k per month with a 4x ROAS and generates £15k in monthly CM3. Brand B spends £150k per month with a 2.5x ROAS and generates £40k in monthly CM3.
Brand B looks worse on every ratio. It’s making nearly three times the profit.
Now layer in repeat purchases. If a customer comes back within six months and buys again — without you paying a new acquisition cost — that repeat CM2 is pure margin added to the original customer. What looked like a break-even first purchase suddenly becomes very profitable over a six-month window.
Measure this on a blended basis first, across all your marketing. Then model it per channel, so you understand where your next marginal pound is working hardest.
How to calculate it
The maths isn’t complicated. What’s harder is getting all the inputs into one place.
You need your:
average order value,
discount rate,
COGS per order,
shipping cost,
payment processing fees,
total marketing spend,
CPA,
LTV over various time periods
I’ve built a free calculator that takes all of these inputs and generates your CM1, CM2, and CM3, then models five different scaling scenarios automatically so you can see exactly what happens to total gross profit as you trade efficiency for volume. It also includes an incrementality worksheet, so you can model what your real CPA might look like once you account for non-incremental conversions. Link at the bottom.
For brands doing this properly, the gold standard is a lightweight data pipeline that combines your COGS data, sales data, and spend data into one unified view.
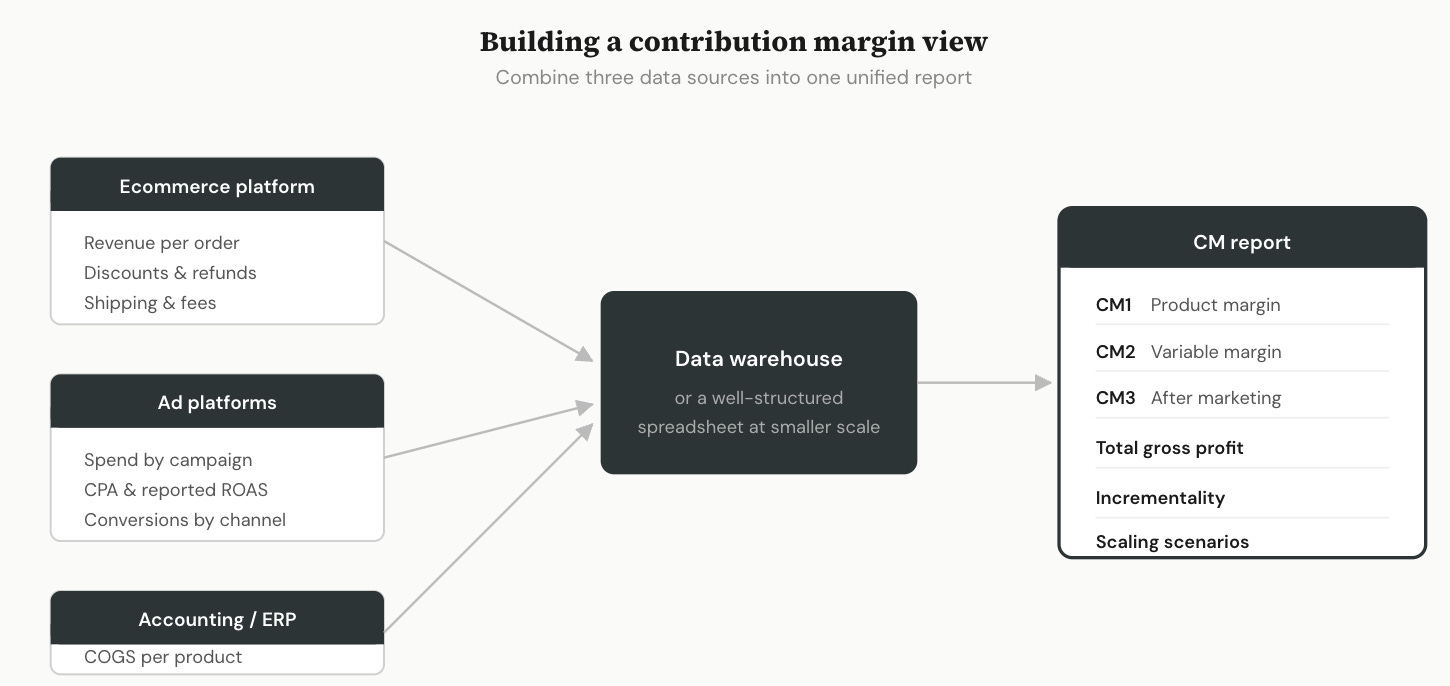
It doesn’t need to be complex, even a well-structured spreadsheet can do the job at smaller scale. But having these numbers in one place is what unlocks the ability to make real decisions rather than reacting to platform dashboards.
How to present this to leadership
Once you can see contribution margin clearly, the conversation changes completely.
Instead of reporting “we achieved a 3.5x ROAS this month,” which invites the inevitable follow-up “can we get it to 4x?”, you’re saying: “We generated £85k in gross profit from £200k in marketing spend, and our six-month customer value suggests that figure will reach £120k.”
That’s a conversation about investment and scale. Not about squeezing a ratio.
There’s one question every marketer should ask their finance team: what level of gross profit do we need to cover our operating expenses?
When you know that number, you can model precisely how much marketing spend gets you there and all the trade-offs between efficiency and volume. This is the conversation your CFO actually wants to have. They don’t care about ROAS. They care about whether marketing generates enough gross profit to cover its share of the business’s fixed costs and contribute to the bottom line.
Stop reporting ratios. Start reporting cash contribution.
Thanks
I’ve introduced CM3 to over 30 brands now, and it has been one of the biggest strategic unlocks in thinking through performance marketing. Remember, Meta is a scale channel not an efficiency one.
I’d love to hear your experiences with CM3 in the comments or if you want to email, hit reply and let me know.
Josh
The Contribution Margin calculator
I’ve put together a contribution margin calculator as a Google Sheet. Plug in your unit economics and it gives you CM1, CM2 and CM3, plus five scaling scenarios that show what happens to total gross profit as you increase spend at different efficiency levels. There’s also an incrementality tab to model what your real CPA might look like when you account for the fact that not every platform-reported conversion was truly incremental.
Keep reading with a 7-day free trial
Subscribe to Early Stage Growth • Ballpoint to keep reading this post and get 7 days of free access to the full post archives.