TL;DR
Alongside its click and view-based windows, Meta has introduced “incremental attribution” an attempt to help prove what ads are actually driving performance. Based on our own incrementality data, we’re not yet sold.
Incremental Attribution got everyone excited a month ago when it launched, but now a handful of experiments in, it’s still leaving something to be desired.
We’ve been exploring specific experiments with around half of our clients, as well as comparing incremental CPA vs the normal 7dc1dv CPA.
But also importantly we’ve recently concluded an actual incremental lift test of our own and compared it to how Meta’s data is reporting.
Here are our thoughts on this so far.
What is incremental attribution in Meta?
Meta’s default attribution window is ‘7 day click, 1 day view’. What this means is it judges whether a conversion happened within either a 7 days of a user clicking the ad or 1 day of viewing the ad. It should be pointed out, due to data gaps, this is modelled behaviour.
Differences between attribution and incrementality
As we touch on in a startup guide to measurement, attribution is just one part of a solid measurement framework. Attribution is the attempt to map an outcome to an action: did this ad click create a result.
Attribution is fast, but inaccurate. Each channel will both under and over attribute depending on its modelling method.
Incrementality is the study of trying to determine what actually happened. And the methods to do this are holdout tests of some kind: exposing one group of people to an activity, and another group with none. Incrementality tests are expensive. They require very high volumes of data, they require holdout groups and controls, and so you can expect to see significantly higher CPAs during these experiments. But they are the highest degree of accuracy for proving if an activity actually did something.
One of the ways you can run incrementality tests in Meta is using a ‘Conversion Lift’ this is a test withheld for those spending above certain thresholds or with rep-managed accounts.
What is incremental attribution
Incremental attribution is a method that Meta have divised based on all of their Conversion Lift data. The idea being that it should take the learnings for what actually drives actual and apply it to any account, regardless of their own studies.
There’s two-sides to incremental attribution.
Viewing the data alongside your usual attribution
Optimising towards incremental attribution
Meta is very good at doing what you tell it to do. And so, if you ask it to focus on incremental attribution, it should opt for those conversions it can predict will be incremental rather than other conversions.
On paper, both of these are great things. Being able to see what is incremental gives you a truer picture of your ads. And being able to then force Meta to acquire those who are incremental further gives more signal towards those people.
Our own incremental lift study vs Meta data
Almost all of our clients are too small to have proper lift work done. Conversion lift, where available, is always too expensive to run regularly for prospecting.
But one area where we can more affordably and more frequently run incrementality testing is with retention. Here’s how we properly measure retention marketing and our methodology.
The TL;DR is
Create proper cohorts of your existing customers
Sync those cohorts to Meta Custom Audiences
Advertise to randomised samples of those cohorts
Measure incrementality off platform.
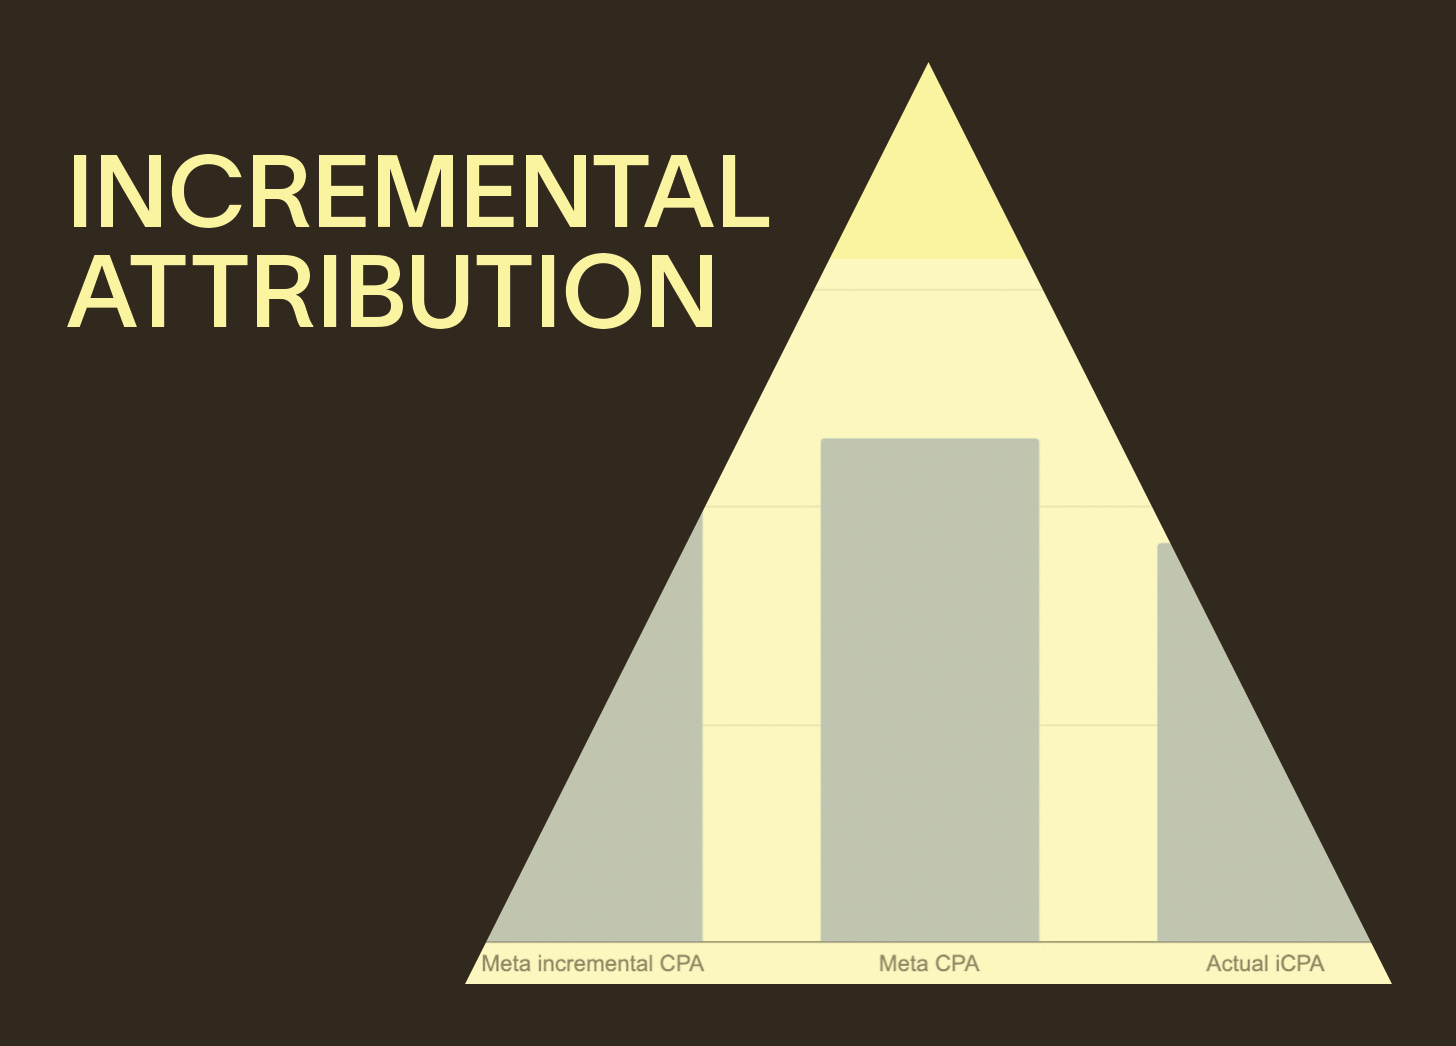
The above chart is from one of our tests we’ve run recently.
How we ran the test
We exposed 60% of the customers to advertising activity, and 40% as a holdout.
We measured sales in those two cohorts.
We took the conversion rate of the holdout group as a baseline.
We used that to calculate the incremental increase in CVR from the ad activity.
We multiplied the incremental lift by cohort size to get incremental volume
We divided spend per cohort, adjusted for cohort size, by the incremental volume
Ta-da, incremental CPA (iCPA).
Meta’s 7dc1dv CPA was £4.64
Meta’s incremental CPA was £5.5
Our own incremental CPA was £3.67
Now Meta’s normal attribution was underreporting against our own benchmark by 20%, but its incremental CPA underreported by 33%.
In both of these cases we used our own data to inform the decision making on continued activity and used 7dc1dv CPA as a proxy for true incremental CPA.
So in the one direct test where we have incremental data, this has proven Meta’s system to be incorrect from a measurement perspective.
Incremental attribution vs normal attribution
In addition to comparing the incremental attribution reporting, we’ve also ran side by side tests of the two attribution routes.
Note: this methodology is flawed because Meta’s A/B tool doesn’t allow A/B tests with different attribution windows.
And so we ran these tests side-by-side meaning there is potential audience overlap here. This is a risk because Meta will divert a pound of spend towards where it believes it can get the most result. And so if given two options, it’ll like share the impression where it can get the result.
Test 1
In the first test, we saw these results. The top-ad set was the normal attribution and bottom incremental.
Now this is an ad set type that typically receives 60-70% of conversions as click-based – and also during this period of time would more typically receive ~ 50 conversions per week.
The ad set reported that just 16% of conversions were incremental, and oddly for the setup just 12% click-based.
Both delivered the same volume of ‘incremental’ conversions.
Behaviour changed a lot in this test: volume went down, our normal set up shifted from 65% click to just 12%, and both showed very few incremental attributions.
Test was inconclusive, we moved back to Standard Attribution and within two weeks it had returned to the usual rate of click conversions with incremental linking close behind.
We did test for any unusual activity that might have driven high view in that window, but couldn’t identify much at all
Test 2
For another brand where we were running lead gen activity.
Here we found that the Standard campaign reported 5.4% more conversions. But more interestingly, normal attribution it also had more incremental conversions (1.3%).
In both data sets, p value wasn’t significant (analysing conversions / reach for comparison) with .2 and .4 for all conversions and incremental respectively.
Another inconclusive test with the data not hinting at a better performance for incremental. We kept setup the same.
Test 3
In a third account setup, the newish client still struggles with an incrementality issue on Meta, which we’ve been aware of outside of the new reporting. The above screen shot shows a good example of this:
32% of conversions are click-based
29% are marked as incremental
This felt like a great potential client to use the new focus on. We rebuilt the hero and gave it the same budget as the above campaign.
In it’s first week, it acquired:
9 incremental purchases
5.4x higher iCPA as a result
Didn’t exit learning
No statistical signifiance
Inconclusive test.
Incremental attribution still has some way to go
It’s a brilliant feature idea. I love that Meta have such a rich history of incrementality lift studies to use and mine from. These four examples are four of seven which all follow a similar pattern:
Incremental campaigns acquire lower volumes than non-incremental – as measured by the incremental figure
For most purchase campaigns this proves to be so detrimental as to reducing purchase volume and therefore impact learning
For those with good data, the implication is it’s no different
For the one test where we had off-site incremental data, we proved that it – and the 7dc1dv data – were both incorrect and underattributed compared to true data.
Incrementality is vital. But so far the experiments we’ve run don’t support using the incremental attribution as an optimisation method.
Looking across the 20 accounts we manage, we find that incremental CPA and click CPA are usually quite close together – often with a small percentage of view conversions added on top.
It’s early days. I hear whispers that Meta are going to continue to focus on this in coming months. But so far, we’re sticking to standard attribution.
As ever, these are tests you should run yourself. Our data is UK only, predominantly DTC, and for clients spending £30k-220k/month. And so you should always test this yourself, but so far, we’re happy leaving this for another few months until it gets a re-test.
🔗 When you’re ready, here’s how Ballpoint can help you
→ Profitably grow paid social spend from £30k/m → £300k/m
→ Create full funnel, jobs to be done-focused creative: Meta, TikTok, YouTube
→ Improve your conversion rate with landing pages and fully managed CRO
→ Maximise LTV through strategic retention and CRM - not just sending out your emails
Email me – or visit Ballpoint to find out more.
NB: We support brands spending above £20k/month.
❤️🔥 Subscribe to our Substack to learn how to grow yourself
… because agencies aren’t for everyone, but our mission is to help all exciting challenger brands succeed and so we give away learnings, advice, how-tos, and reflections on the industry every week here in Early Stage Growth.