
Killing creative tests at day 5
How long should you run creative tests for is an age-old question, we analyse 12 months of experiments to find out.

TL;DR: We analysed £7.5m of ad experiments to understand how quickly you can make judgements on winners/losers.
We’ve all been there. It’s day two of a new ad test and there’s zero conversions. CPA is currently ‘infinite’ and your CMO is asking “why haven’t you turned that off yet, is it ever going to recover?”
Creative testing remains the most important lever you have on Meta. In the early days it is the difference between 0 and 1. And then during scale days, the rate at which you’re able to test and learn is the deciding factor in how quickly you can grow.
But testing costs money.
There are lots of ways to test. You can test in cost controlled campaigns, in flexible ad formats, in ABO ad sets per concept. You can have a budget assigned to testing like 15% or 20%, or you can have 60%+ effectively as your testing budget.
The cost to test is high in many directions. First you’ve got the cost of putting creative together. That’s a mixture of insight + strategy + briefwriting + creative execution. The AI gurus are promising that cost is 0, but if you’ve seriously pushed volume into the AI creative, you’ll know there’s cost in other places.
Second, then there’s the cost of testing the ad in platform. Depending on your testing approach this might eat up a huge amount of budget.
While the expected value for creative testing should be high – because if your Meta engine is profitable and efficiency, feeding it with good creative is what helps it deliver results – that doesn’t change the fact that a lot of spend goes into ads that won’t ever be seen again.
We’ve just analysed the last 12 months worth of data as part of our annual report, examining 4,000 experiments.
Here are a load of insights from that report.
As with all of these things, you should be analysing this on an account by account perspective. While there are good pieces of data here to average out, these do not mean we will uniformly apply these decisions.
Use this as inspo, rather than vibes decision making.
By day 5, you can likely predict a good or a bad ad
This is one of our biggest learnings. We run seven day tests by default. We do this for a few reasons:
We run most ads on 7 day click, 1 day view attribution windows and so it makes sense to judge against a window you’re asking
In-week volatility exists a lot, and that can be true ad by ad, so we like to test for a whole 7 days.
When trying to identify at what point we can predict winners or losers, we looked at a few measures:
Receiver operating character (ROC) curve
”The area under the ROC curve (AUC) represents the probability that the model, if given a randomly chosen positive and negative example, will rank the positive higher than the negative.”Correlation coefficient between day X CPA and day 7 CPA
This looks at the correlation between two variables.% of ads that are – at day X – within Y% of the day 7 CPA
1. ROC Curve
First of all on the ROC curve, if we define an ad as good/bad at day 7, which in our analysis we defined as having intervened and turned off or kept on, we can usually see whether it will be a good/bad ad at day 5.
The ROC curve is at 0.98 by day 5, meaning 98% of the time we can predict whether we would make the choice we eventually made at day 7.
💡 ACTION: Potentially intervening earlier in tests meaning either: a 28% reduction in testing budget each week, or a 28% increase in creative testing.
Our next steps are to review these curves on a client by client basis, and then also examine days of the week into the mix. We usually have set creative test launch days which means we have less data here to see how it will do across the week.
2. Correlation coefficient
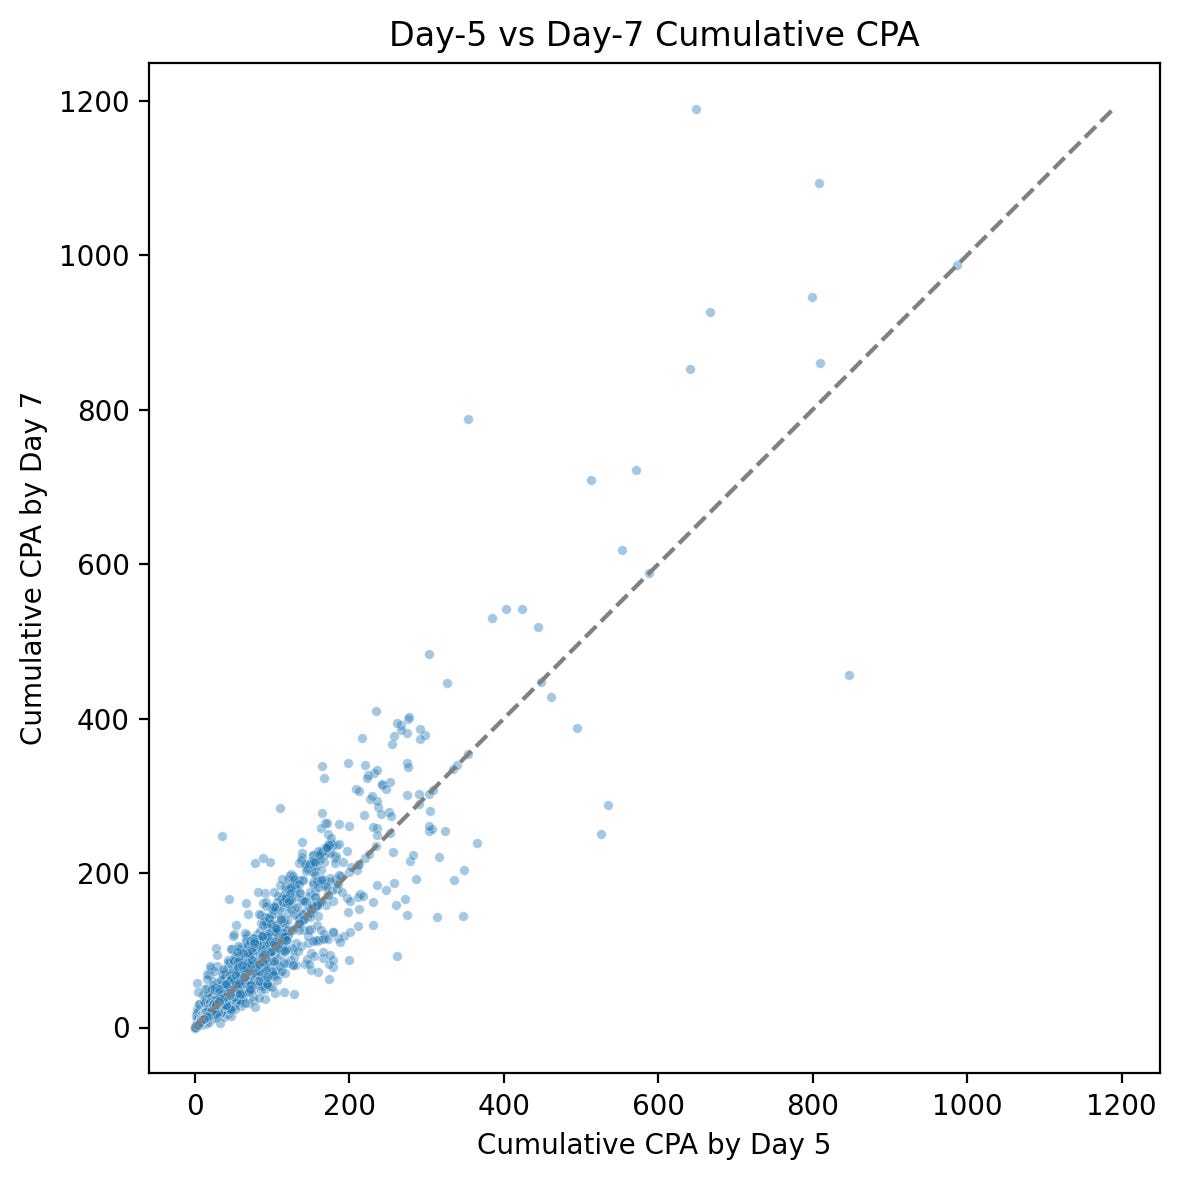
The next Q is how well do they correlate together.
Correlation coefficient shows how closely two variables correlate.
At day 3, there is a .79 correlation coefficient: a strong positive correlation
By day 5, it’s 0.94 – a very strong positive correlation
This shows that the CPAs at day 5 correlate very strongly to the CPAs at day 7 – it doesn’t mean they are the same, but that they align and therefore you can use day 5 CPA as a proxy for day 7 CPA. (All CPAs in our study are accumulative).
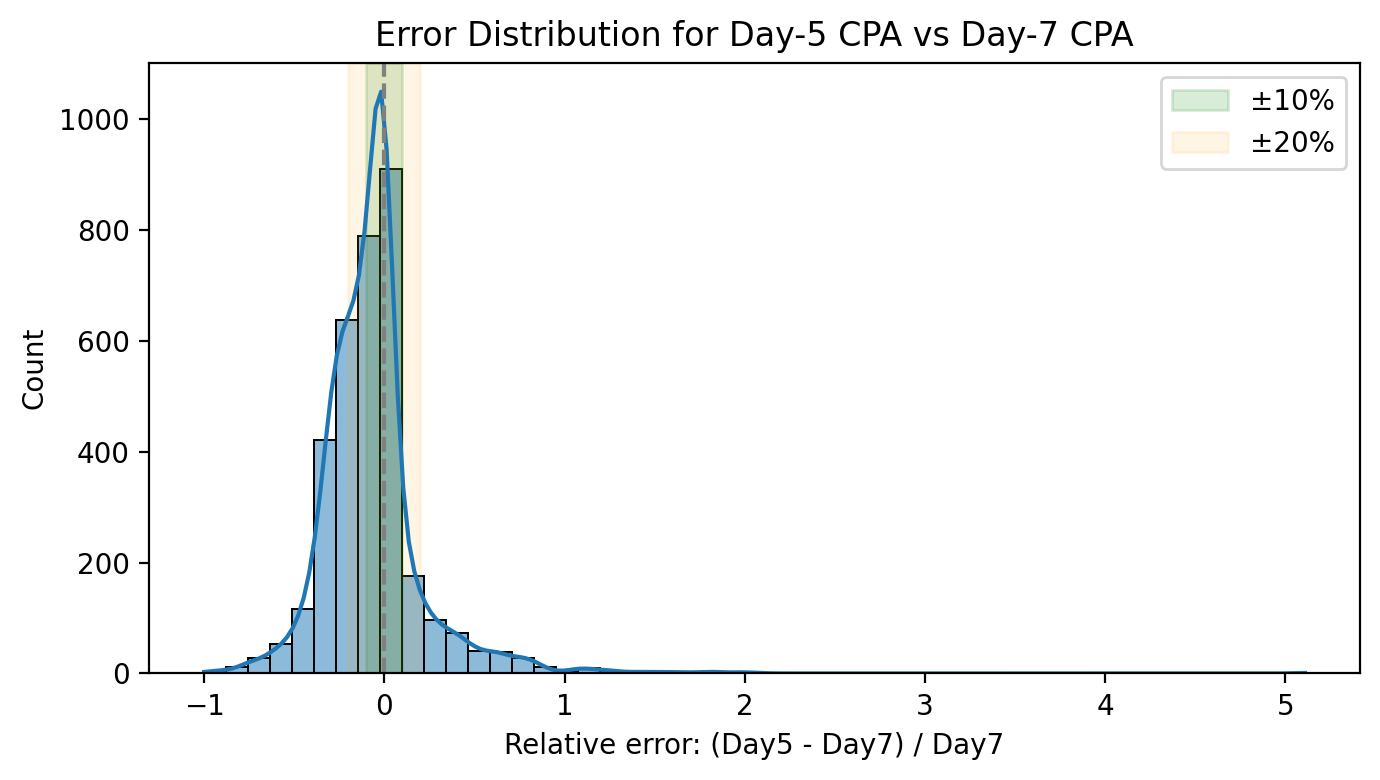
3. How close are the CPAs?
This is where there is a bigger difference that isn’t immaterial.
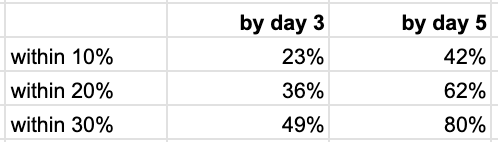
At day 3, we’re not that close at all to the day 7 CPAs: half of the ads are within a wide 30% margin. By day 5, half are closer to 10% of final day 7 CPA.
What about the longer term view?
The second part of our analysis dug into the longer term.
Making decisions at day 7 is one thing, but how well are we making decisions and what happens to ads afterwards?
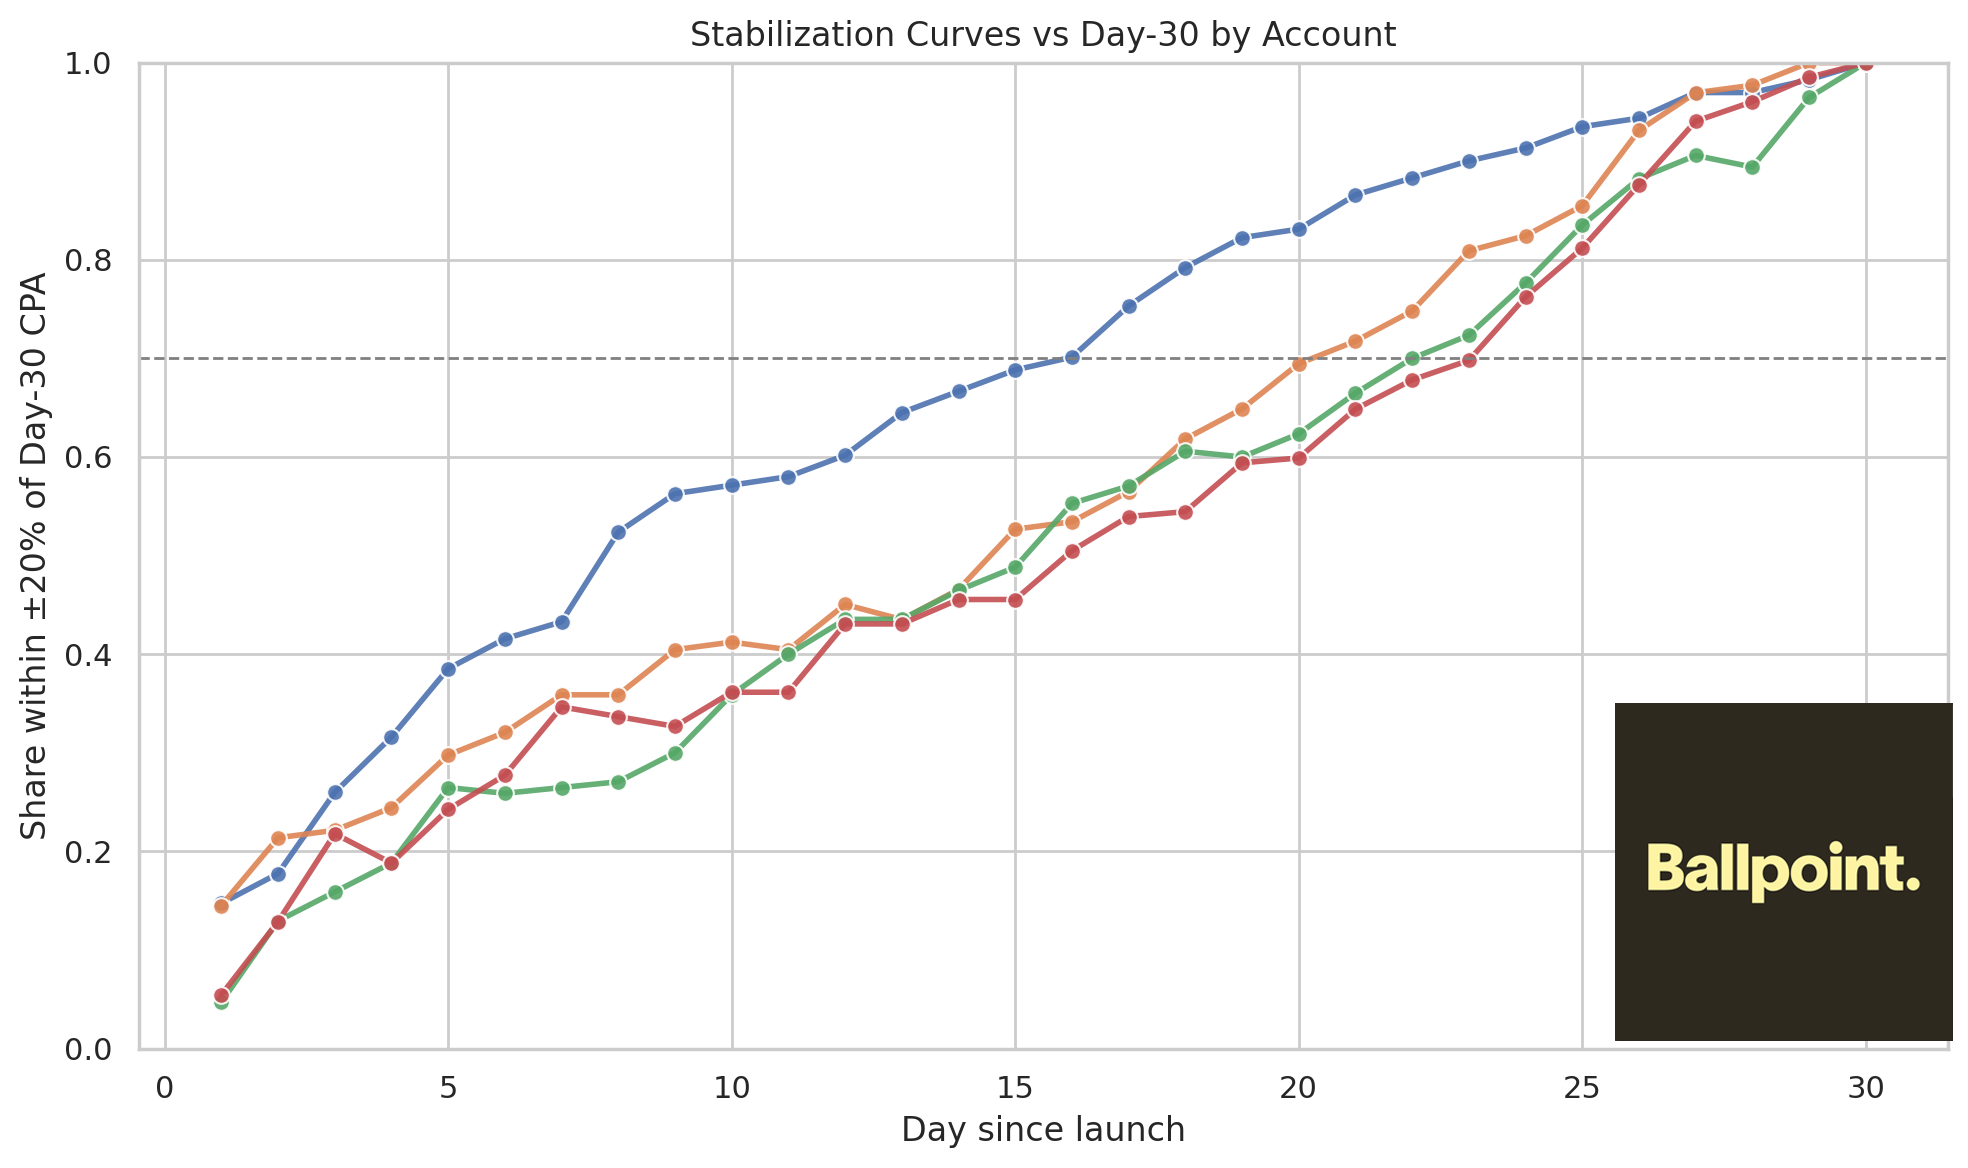
This analysis looks at our four biggest spending accounts, and looks at ads which are still live by day 30 (i.e. those which algorithmically have continued to spend).
For each of these accounts, we have successfully managed to scale these accounts by 2-10x over the last 12 months – at agreed efficiency targets.
One brand has a faster stabilisation rate, which maybe implies we’re better at identifying winners that scale. But even so being within 20% of day 30 CPA shows that there’s actually little stabilisation that takes even with those winners.
In fact:
While only 32% of ‘winning’ ads go on to have a CPA which decreases by day 30.
This is mostly tightly clustered with these four accounts: 28%, 28%, 31% and 39%.
Overall the median CPA change from day 7 to day 30 is a 19% increase in CPA.
We know that Facebook Ads follows a power curve. But this is a really good example of what you need to see for creative winners to sit comfortably in your campaigns.
It’s also to be expected. Most testing campaigns act as a fractionally smaller part of budget. When ads are served to wider audiences they hit diminishing returns. And so if an ad goes from £500 of testing budget to being put into a campaign spending £5k/day – and it goes on to be a : – that will likely hit more diminishing returns.
💡 You need to allow for increases in CPA in the short term
Spend dynamics in the day 7 to day 30 view
So what actually happens in that day 7 to day 30 view. As we promote winning ads after day 7 they go into campaigns that will allow them to spend more. But, importantly, we intervene less here and the spend is algorithmic rather than human-driven.
This is the stage when good ads start to separate from great ads.
The mean spend multiplier is 22x
The median spend multiplier is 4.4x
This means that most ads scale modestly, but then there is a small number that explode.
The differences between CPA improvers and worseners
Most ads increase in CPA during this period, and for those that do, the mean goes to 29x but median is at 4.82
For the ads that decrease in CPA, the mean is a far lower 7.3x and the median is a lower still 3.7x.
Our takeaway here is that this is for the most part the breakdown effect at play, and not a signal of the auction failing, but just one that ads differ from the isolated position of testing to that of being live in Hero campaigns.
Closing thoughts
Identifying earlier winners is something we like to think a lot about, but so too is broader understanding of how ads behave after they become winners.
This should be a good logical reminder that a good CPA in testing does not mean CPA will stay the same at scale.
Ultimately, Meta is a volume channel rather than an efficiency channel. Your goal is to find ads that have strong volume potential with affordable change in CPA.
As pointed out in the intro, this data needs analysing yourself. But for those who aren’t in a position to do so, it should help provide some colour to what happens when a test goes live.
🔗 When you’re ready, here’s how Ballpoint can help you
→ Profitably grow paid social spend from £20k/m → £300k/m
→ Create full funnel, jobs to be done-focused creative: Meta, TikTok, YouTube
→ Improve your conversion rate with landing pages and fully managed CRO
→ Maximise LTV through strategic retention and CRM - not just sending out your emailsEmail me – or visit Ballpoint to find out more.
NB: We support brands spending above £20k/month.
❤️🔥 Subscribe to our Substack to learn how to grow yourself
… because agencies aren’t for everyone, but our mission is to help all exciting challenger brands succeed and so we give away learnings, advice, how-tos, and reflections on the industry every week here in Early Stage Growth.