

Back in April, I started building a scraper that would analyse ad account libraries and in particular the landing pages.
We know first hand how powerful landing pages can be. Our most recent landing page we built outperformed the clients’ PDP by 35%. And historically we see 10-50% improvements against PDPs, homepages, or collections pages, to be the norm.
But we also wanted to study how the biggest brands are doing it.
A few questions I always wanted to answer:
How much should you be testing?
How many brands have singular hero LPs compared to multiple?
Is there a ‘best’ structure?
Does that best structure change over time?
Since April, we’ve analysed 1,956 landing pages across 70 brands. That’s 27 landing pages per brand. Now our list is a list of who’s who in Meta advertising. We specifically analyse those we know to be spending high six and seven figures per month on Meta. Across the 1,956 landing pages, we identified 11,058 content sections.
One of my core hypotheses on landing pages was:
“if this LP is used repeatedly by the brand, we should consider it shit hot”.
So we created a ranking based on the number of instances a landing page is used. If a brand launches 100 ads per week, how do they consolidate around certain pages. And how many of those pages still maintain the most prominent position a month later or maybe three or four?
Every day, when we scraped the LPs, we took screenshots in mobile view of the whole page, and then using Claude have got it to break out every single section into section types, tagged with everything from the type of messaging through to how ‘on brand’ that section is.
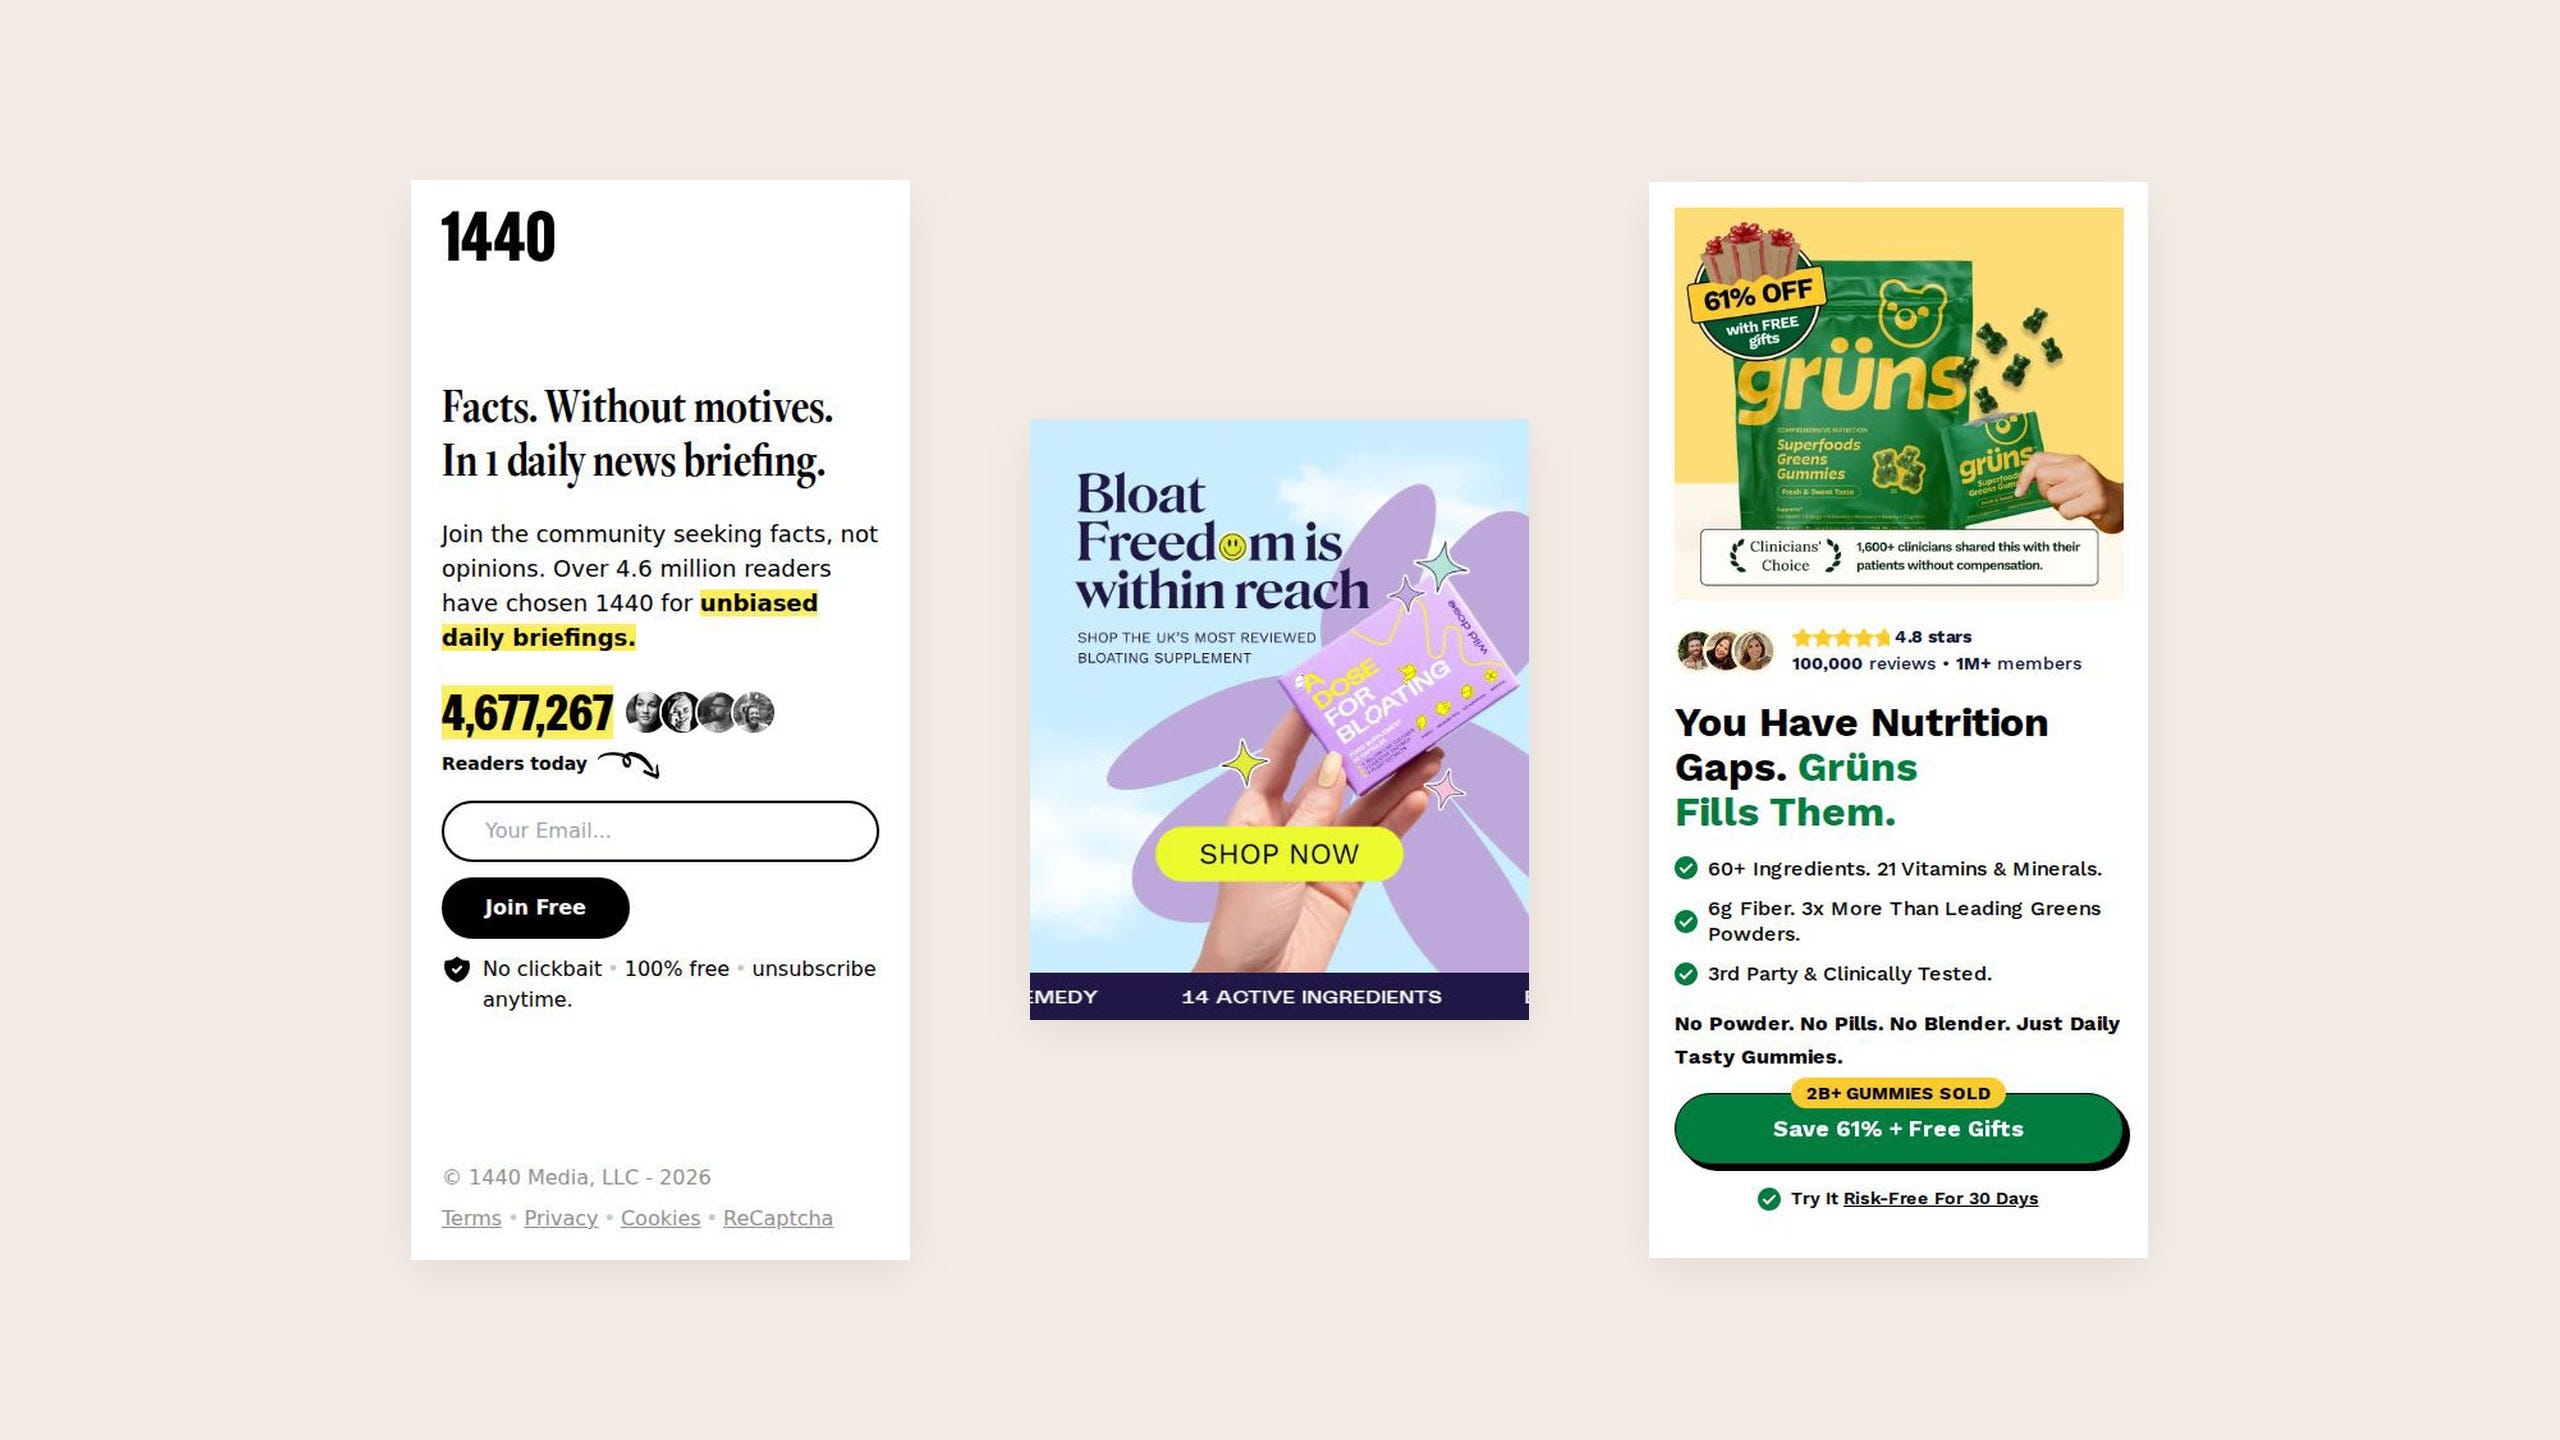
Key learnings from our analysis
First, we wanted to learn if brands had singular landing pages that they kept returning to.
We set the threshold so that at least 10% of the brands ads for an initial 30 day period, and then continued to be used until the end of our analysis period. We called these Hot Repeats.
68% of our analysed brands had Hot Repeats
There were a total of 94 pages that were counted
4.8% of landing pages were hot repeats
If a brand had a page that lasted for at least two months, we called it an Established Page and 160 of the pages fell into this category.
In the last month, 525 pages had been tested for the very first time.
What we wanted to know was of the Hot Repeats and Established Pages, what were the key insights we could learn, relative to the broader groups.
From here on we will refer to the “Best LPs” as those in either Hot Repeats or Established Pages categories.
1. Landing pages & landing page heroes beat product pages
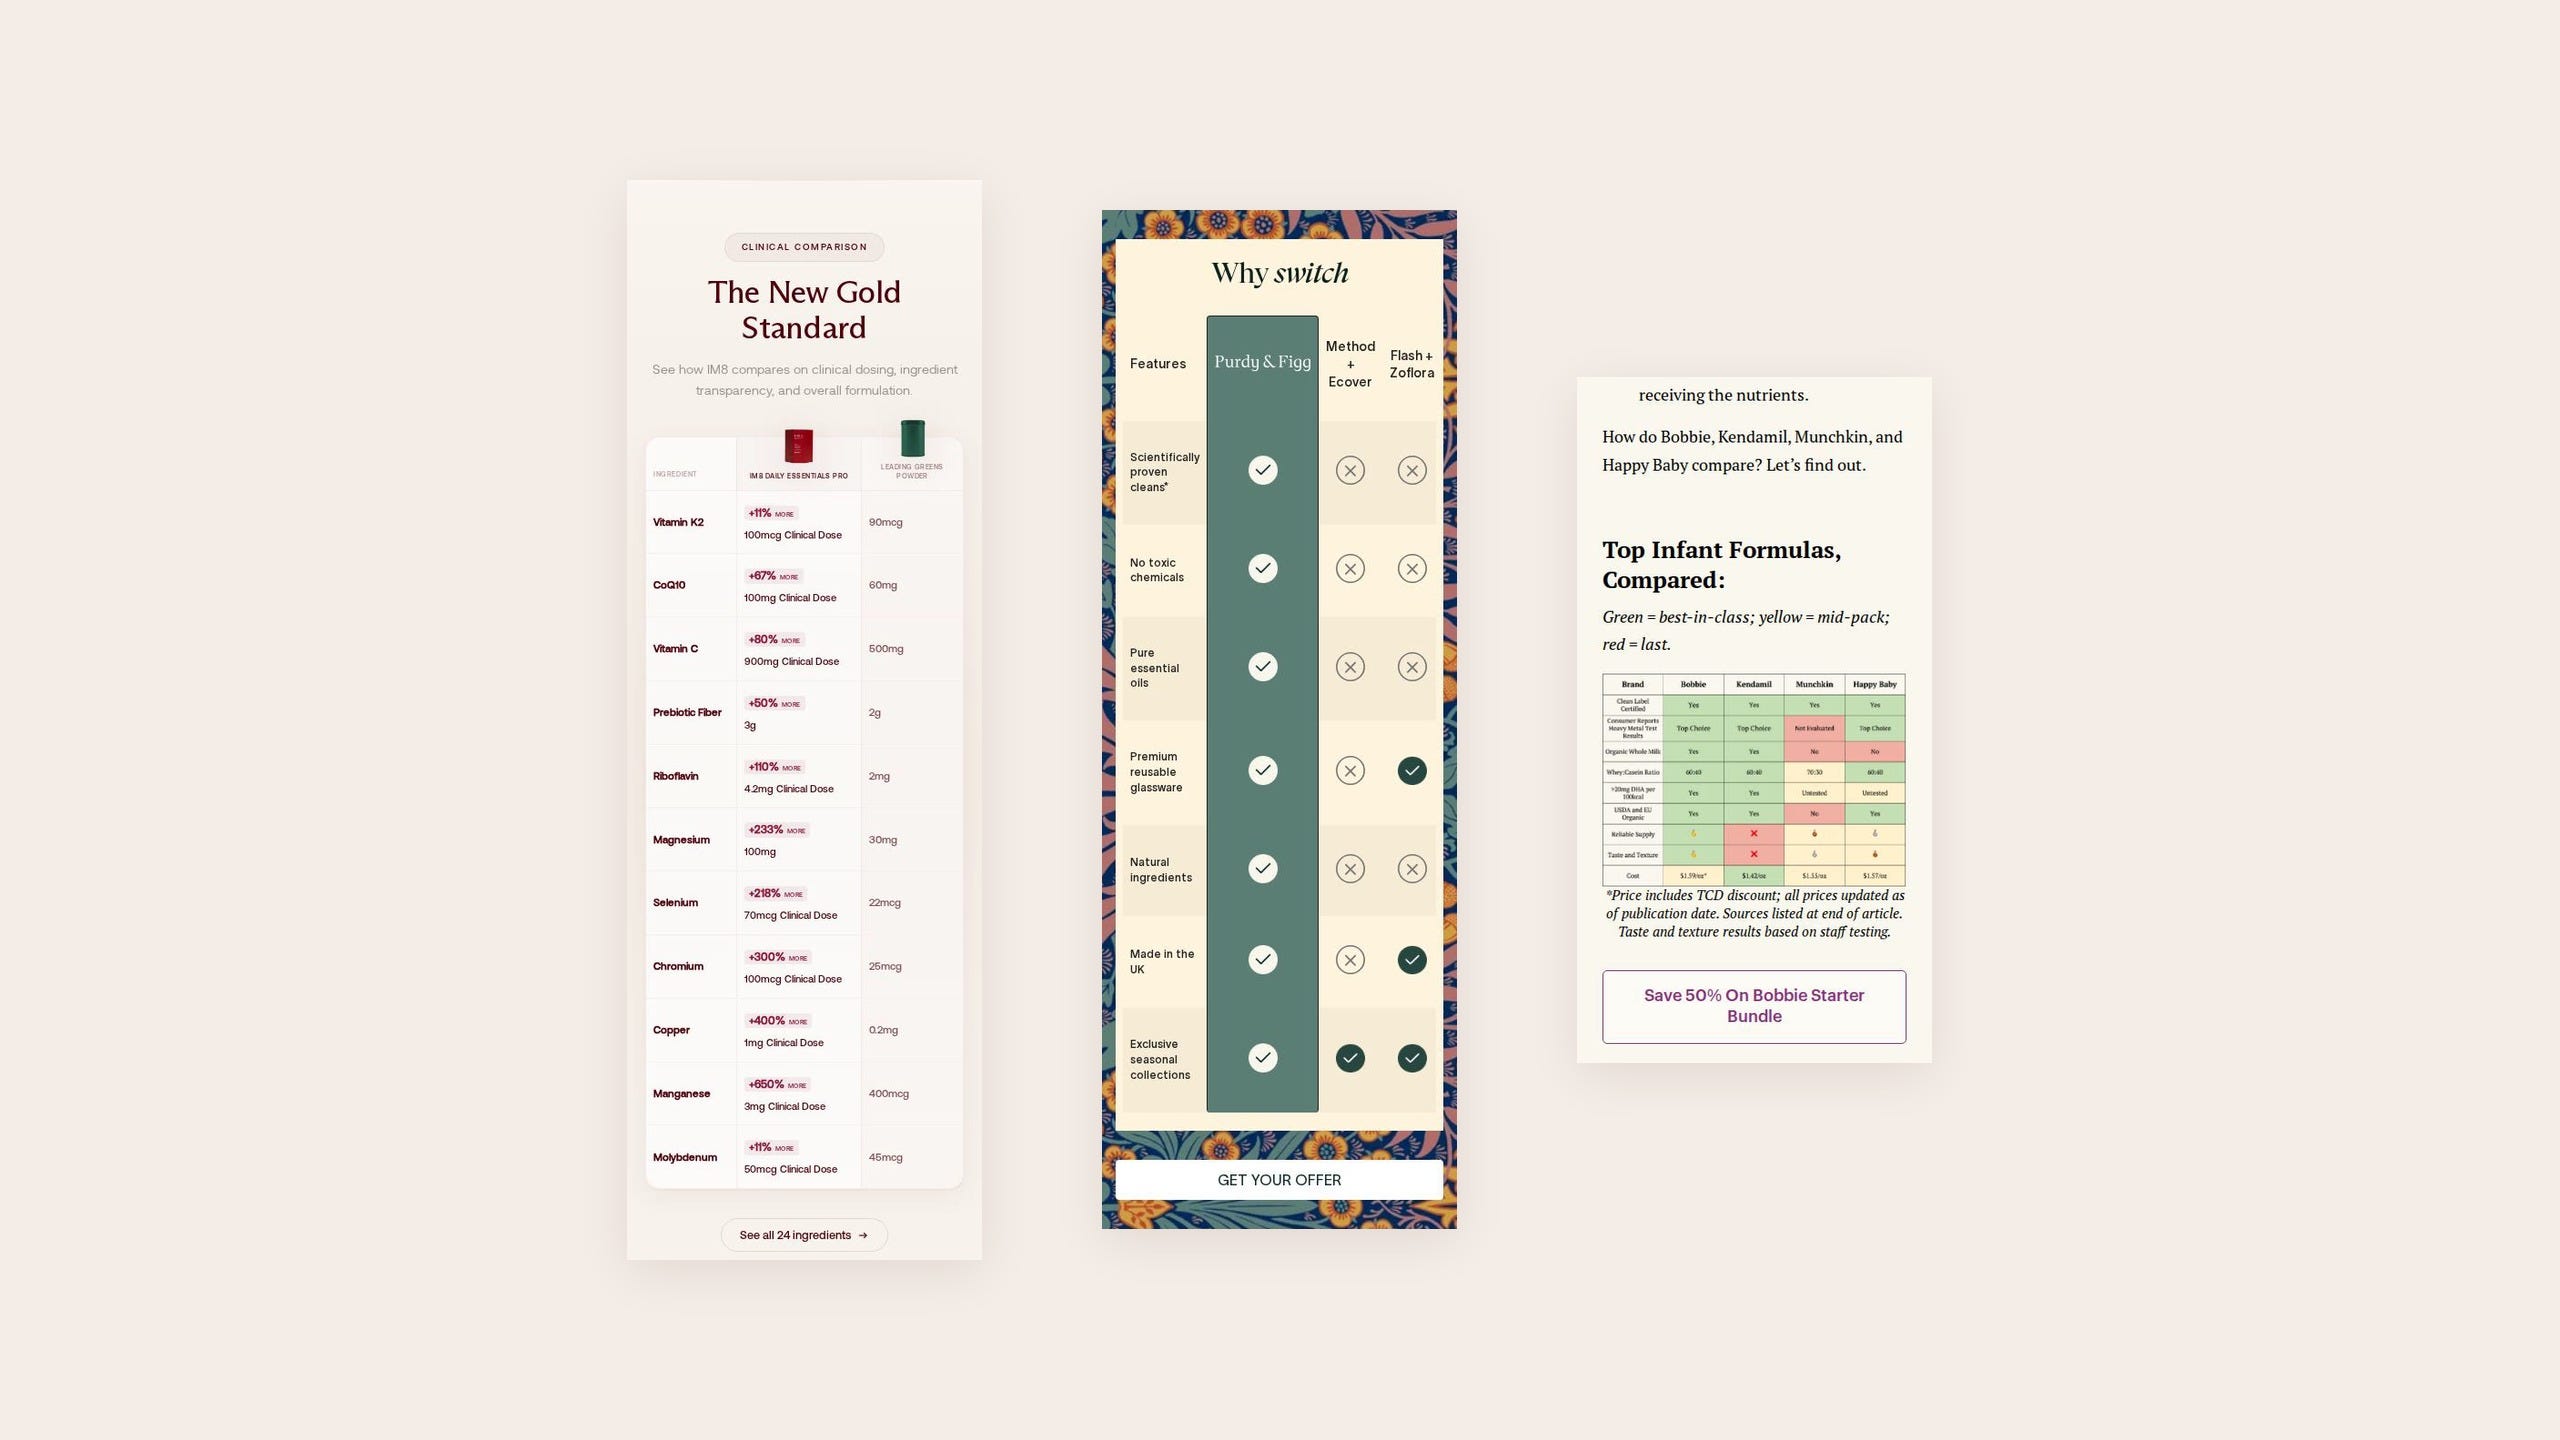
When we look at the Best LPs we have out there, 82% begin with a hero section. And 60% of the Best LPs are landing pages, as opposed to product pages.
Both follow similar patterns.
The Best LPs usually open with a promise of some kind rather than the product itself. PDPs start with the product.
Despite this, non-hero based landing pages account for almost half of all current tests (49% over the last 30 days), and 55% are product pages. While the PDP explains some of that gap, that still shows 10% of all traditional Landing Pages not starting with a Hero
2. Explain the product
It’s time to explain the product, here’s a few stats to support how and why:
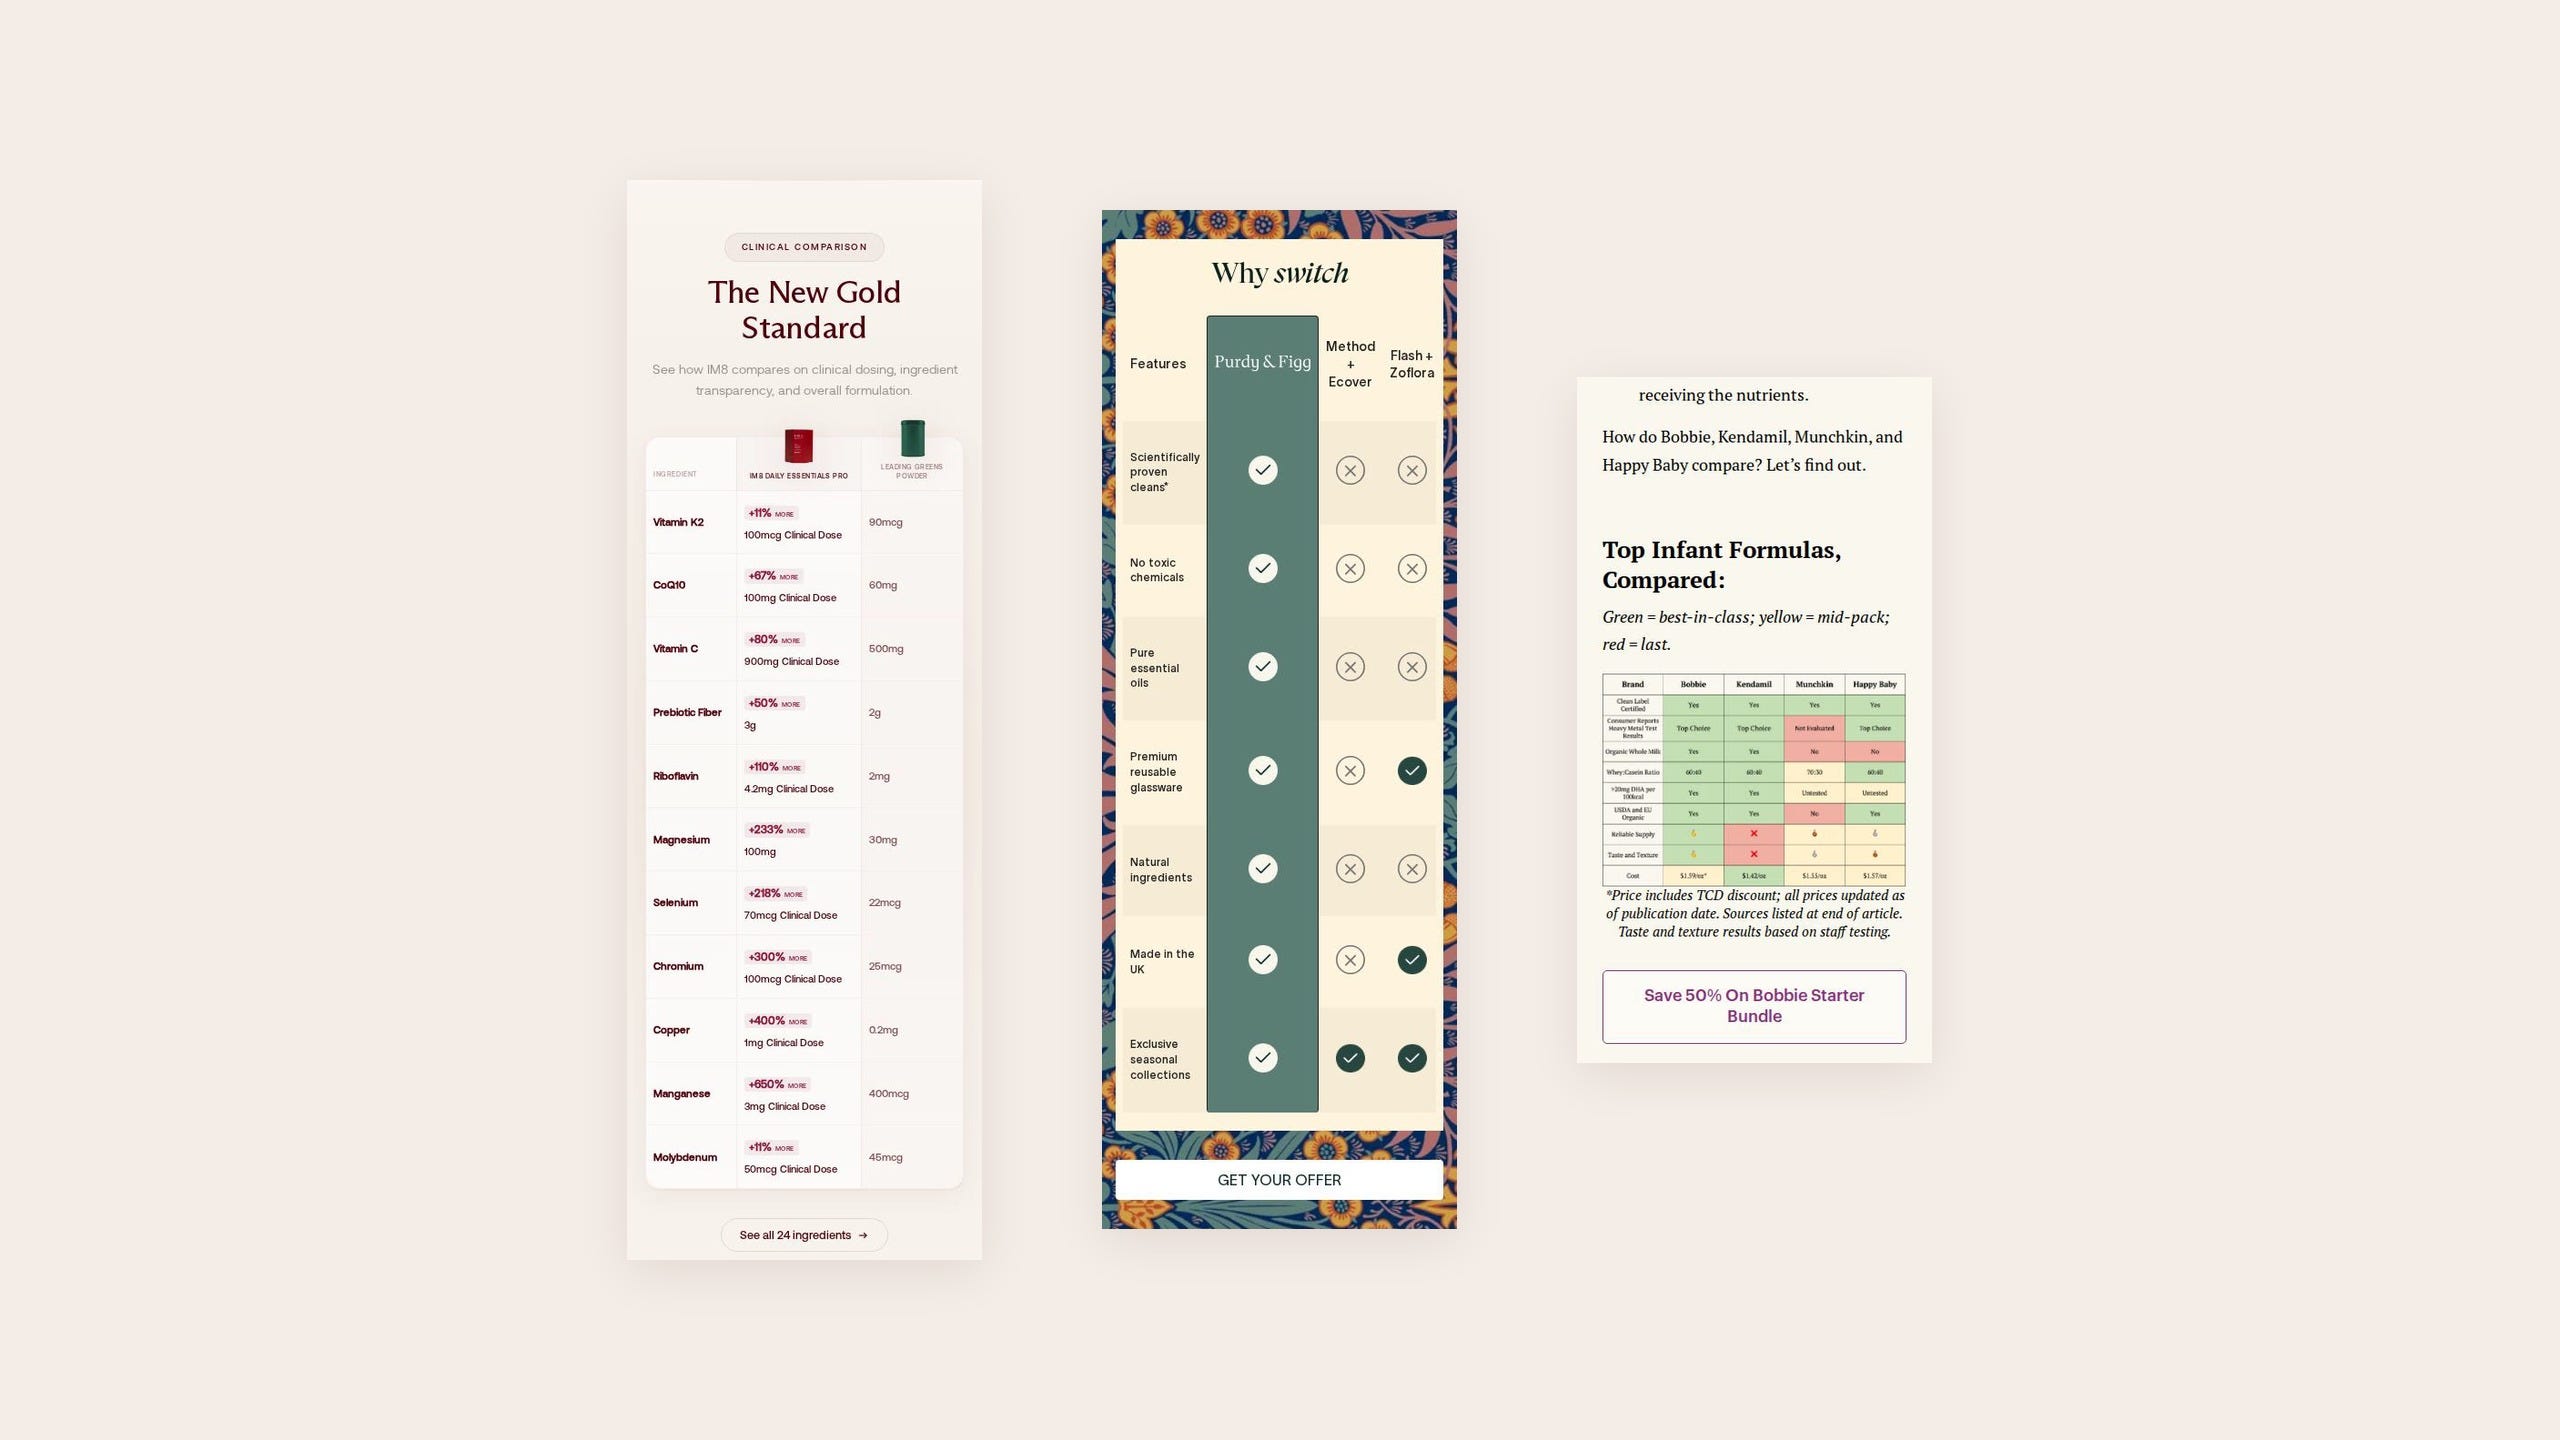
Comparison sections are 2.2x more likely to feature in a Best LP than not.
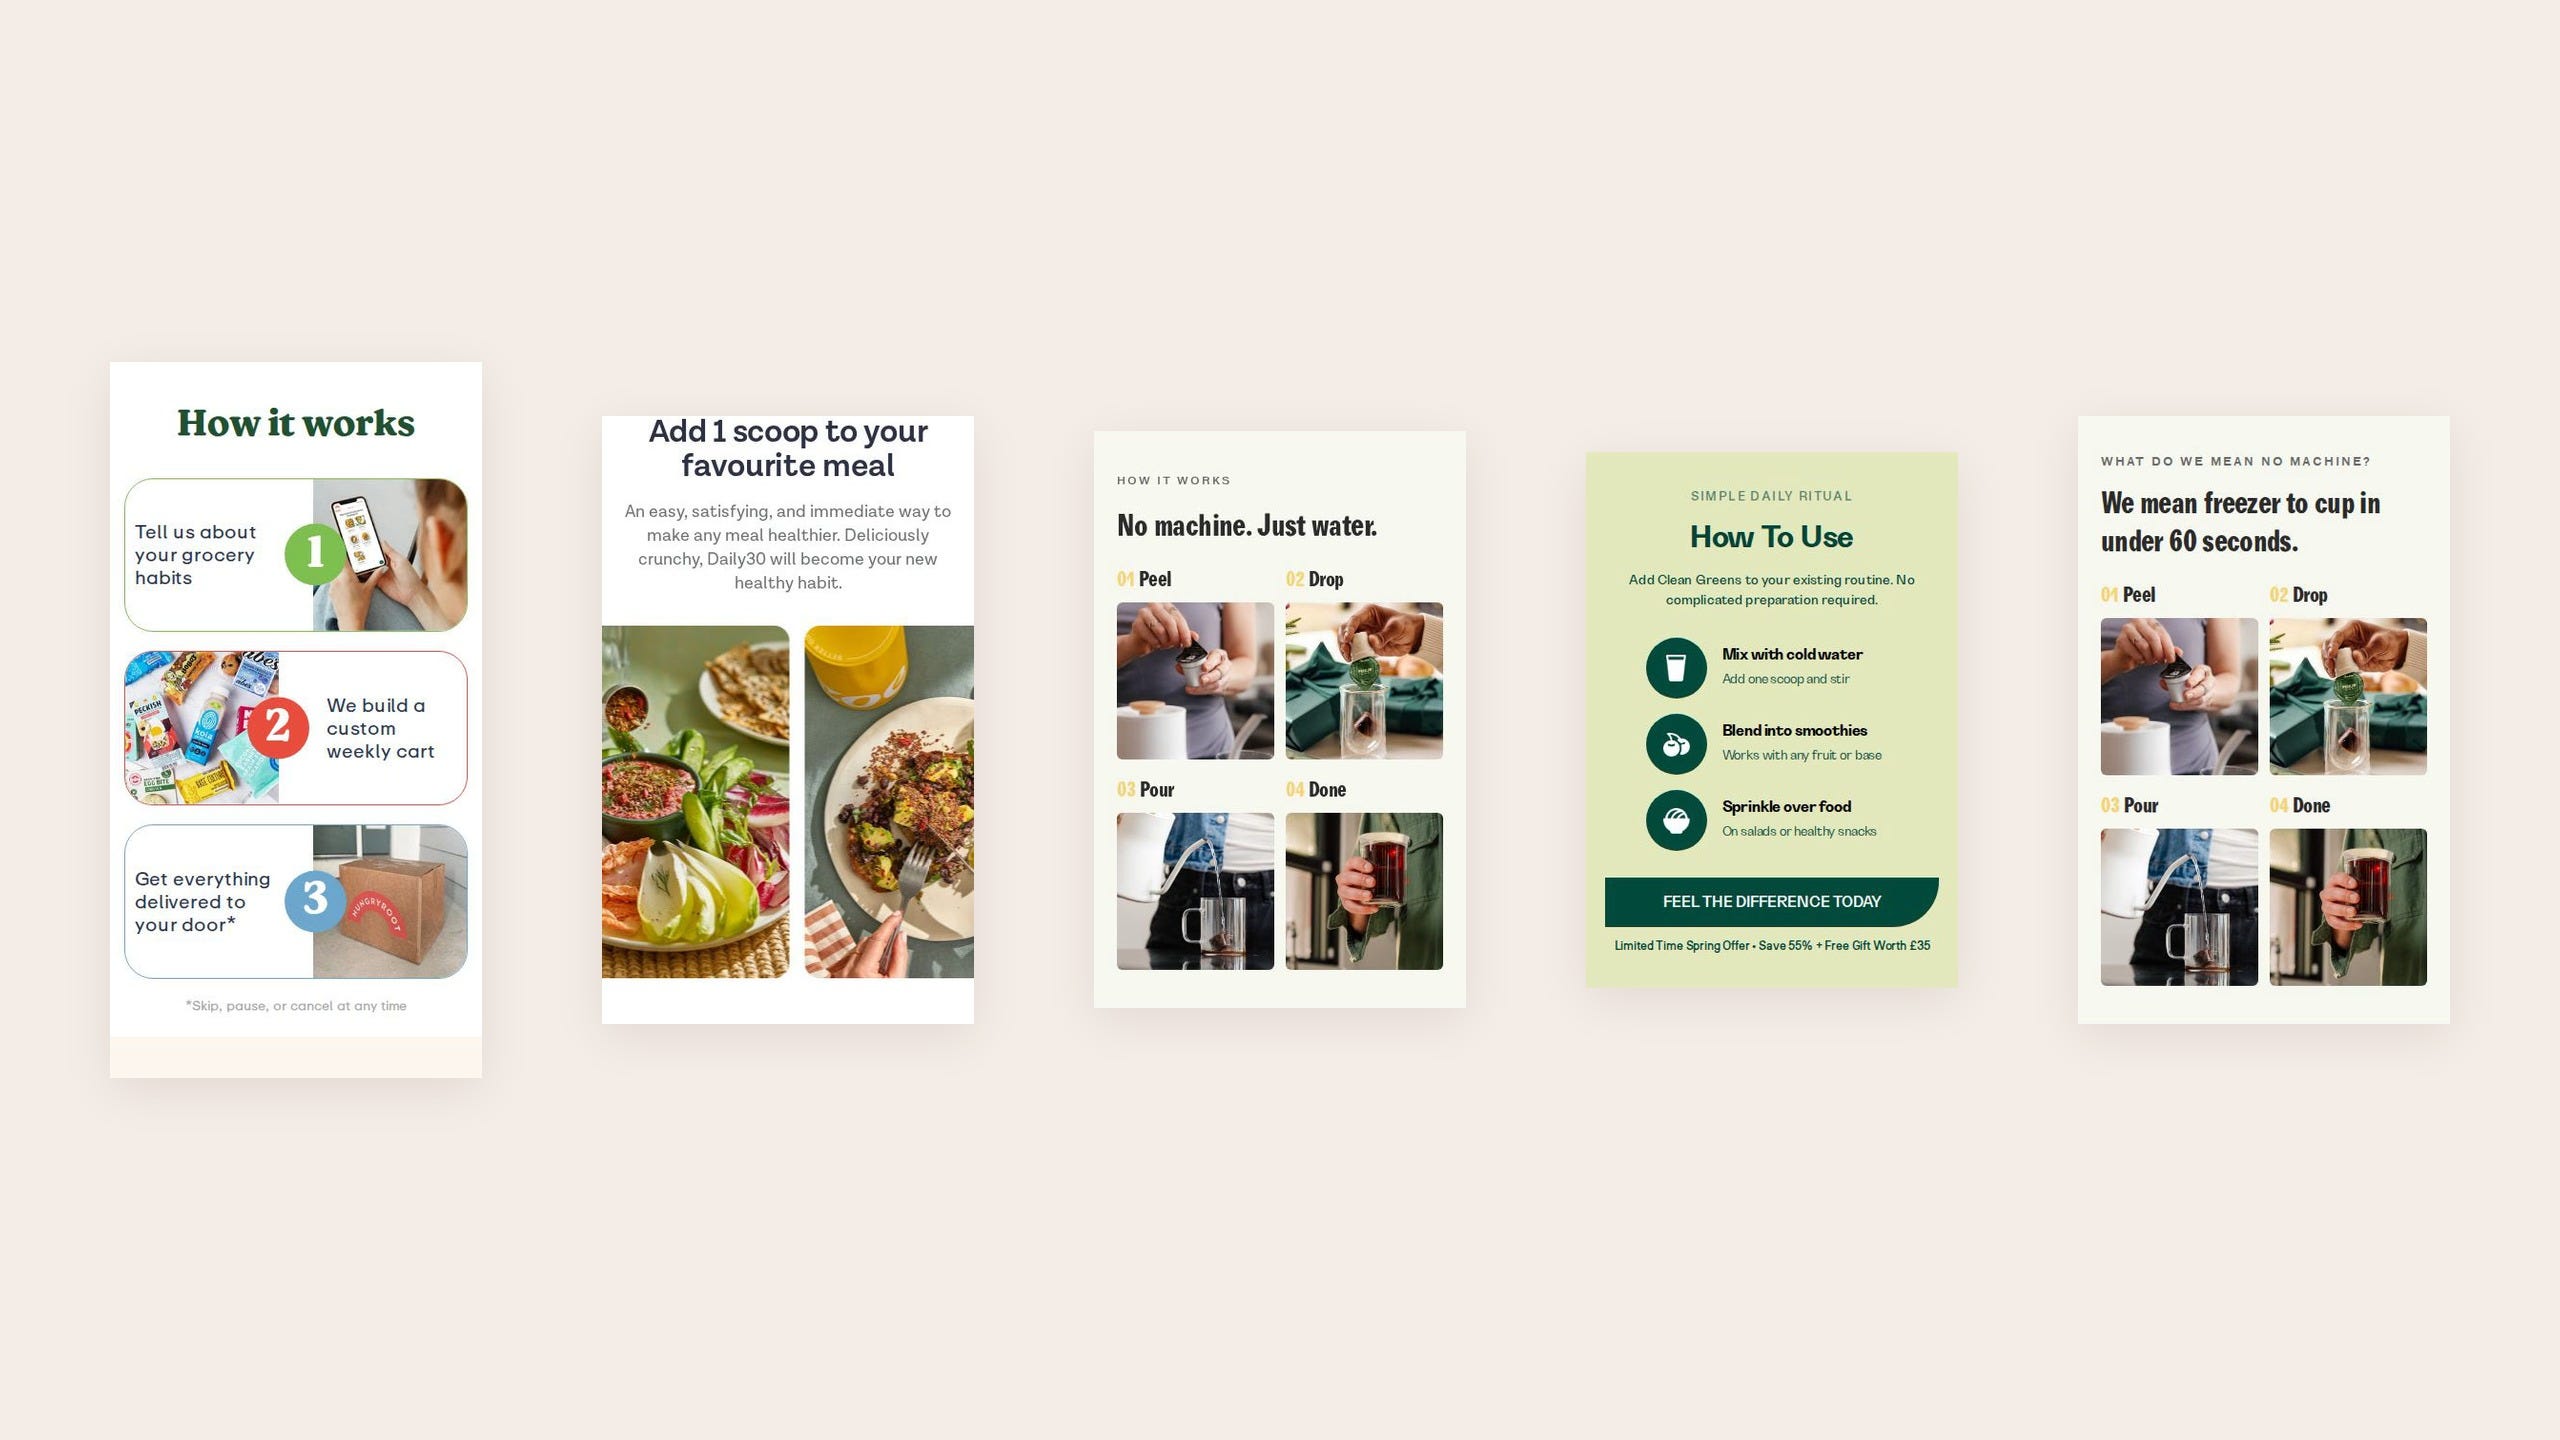
How it works sections are 1.5x more likely to appear
“Why” it works appear 9.3 percentage points more often
It is not enough to just give a benefit. The best LPs repeatedly explain how it works, why it works, and compare it to alternatives
Here are some How it Works sections
How you might want to run Comparison tables.
3. Go long
The Best LPs feature 7 sections, compared to 6 amongst the rest of the LPs.
This goes against a classic trope of short attention spans. While on social, our job is to capture attention quickly and move it to click, once you’re on the LP, you’ve earnt permission to sell.
If you’re ever in doubt about length. Consider Amazon, the world’s most successful e-commerce business, and what they consider an appropriate length for a landing page.

Length shouldn’t be length for lengths sakes. You can’t just repeat information. But use each section to tell a different part of the story. And remember, write and design for skimming rather than full reading. Some people will want to know the why – others won’t care and just want to see how. You want to convert both.
4. Reviews are frequent – though overserved in testing
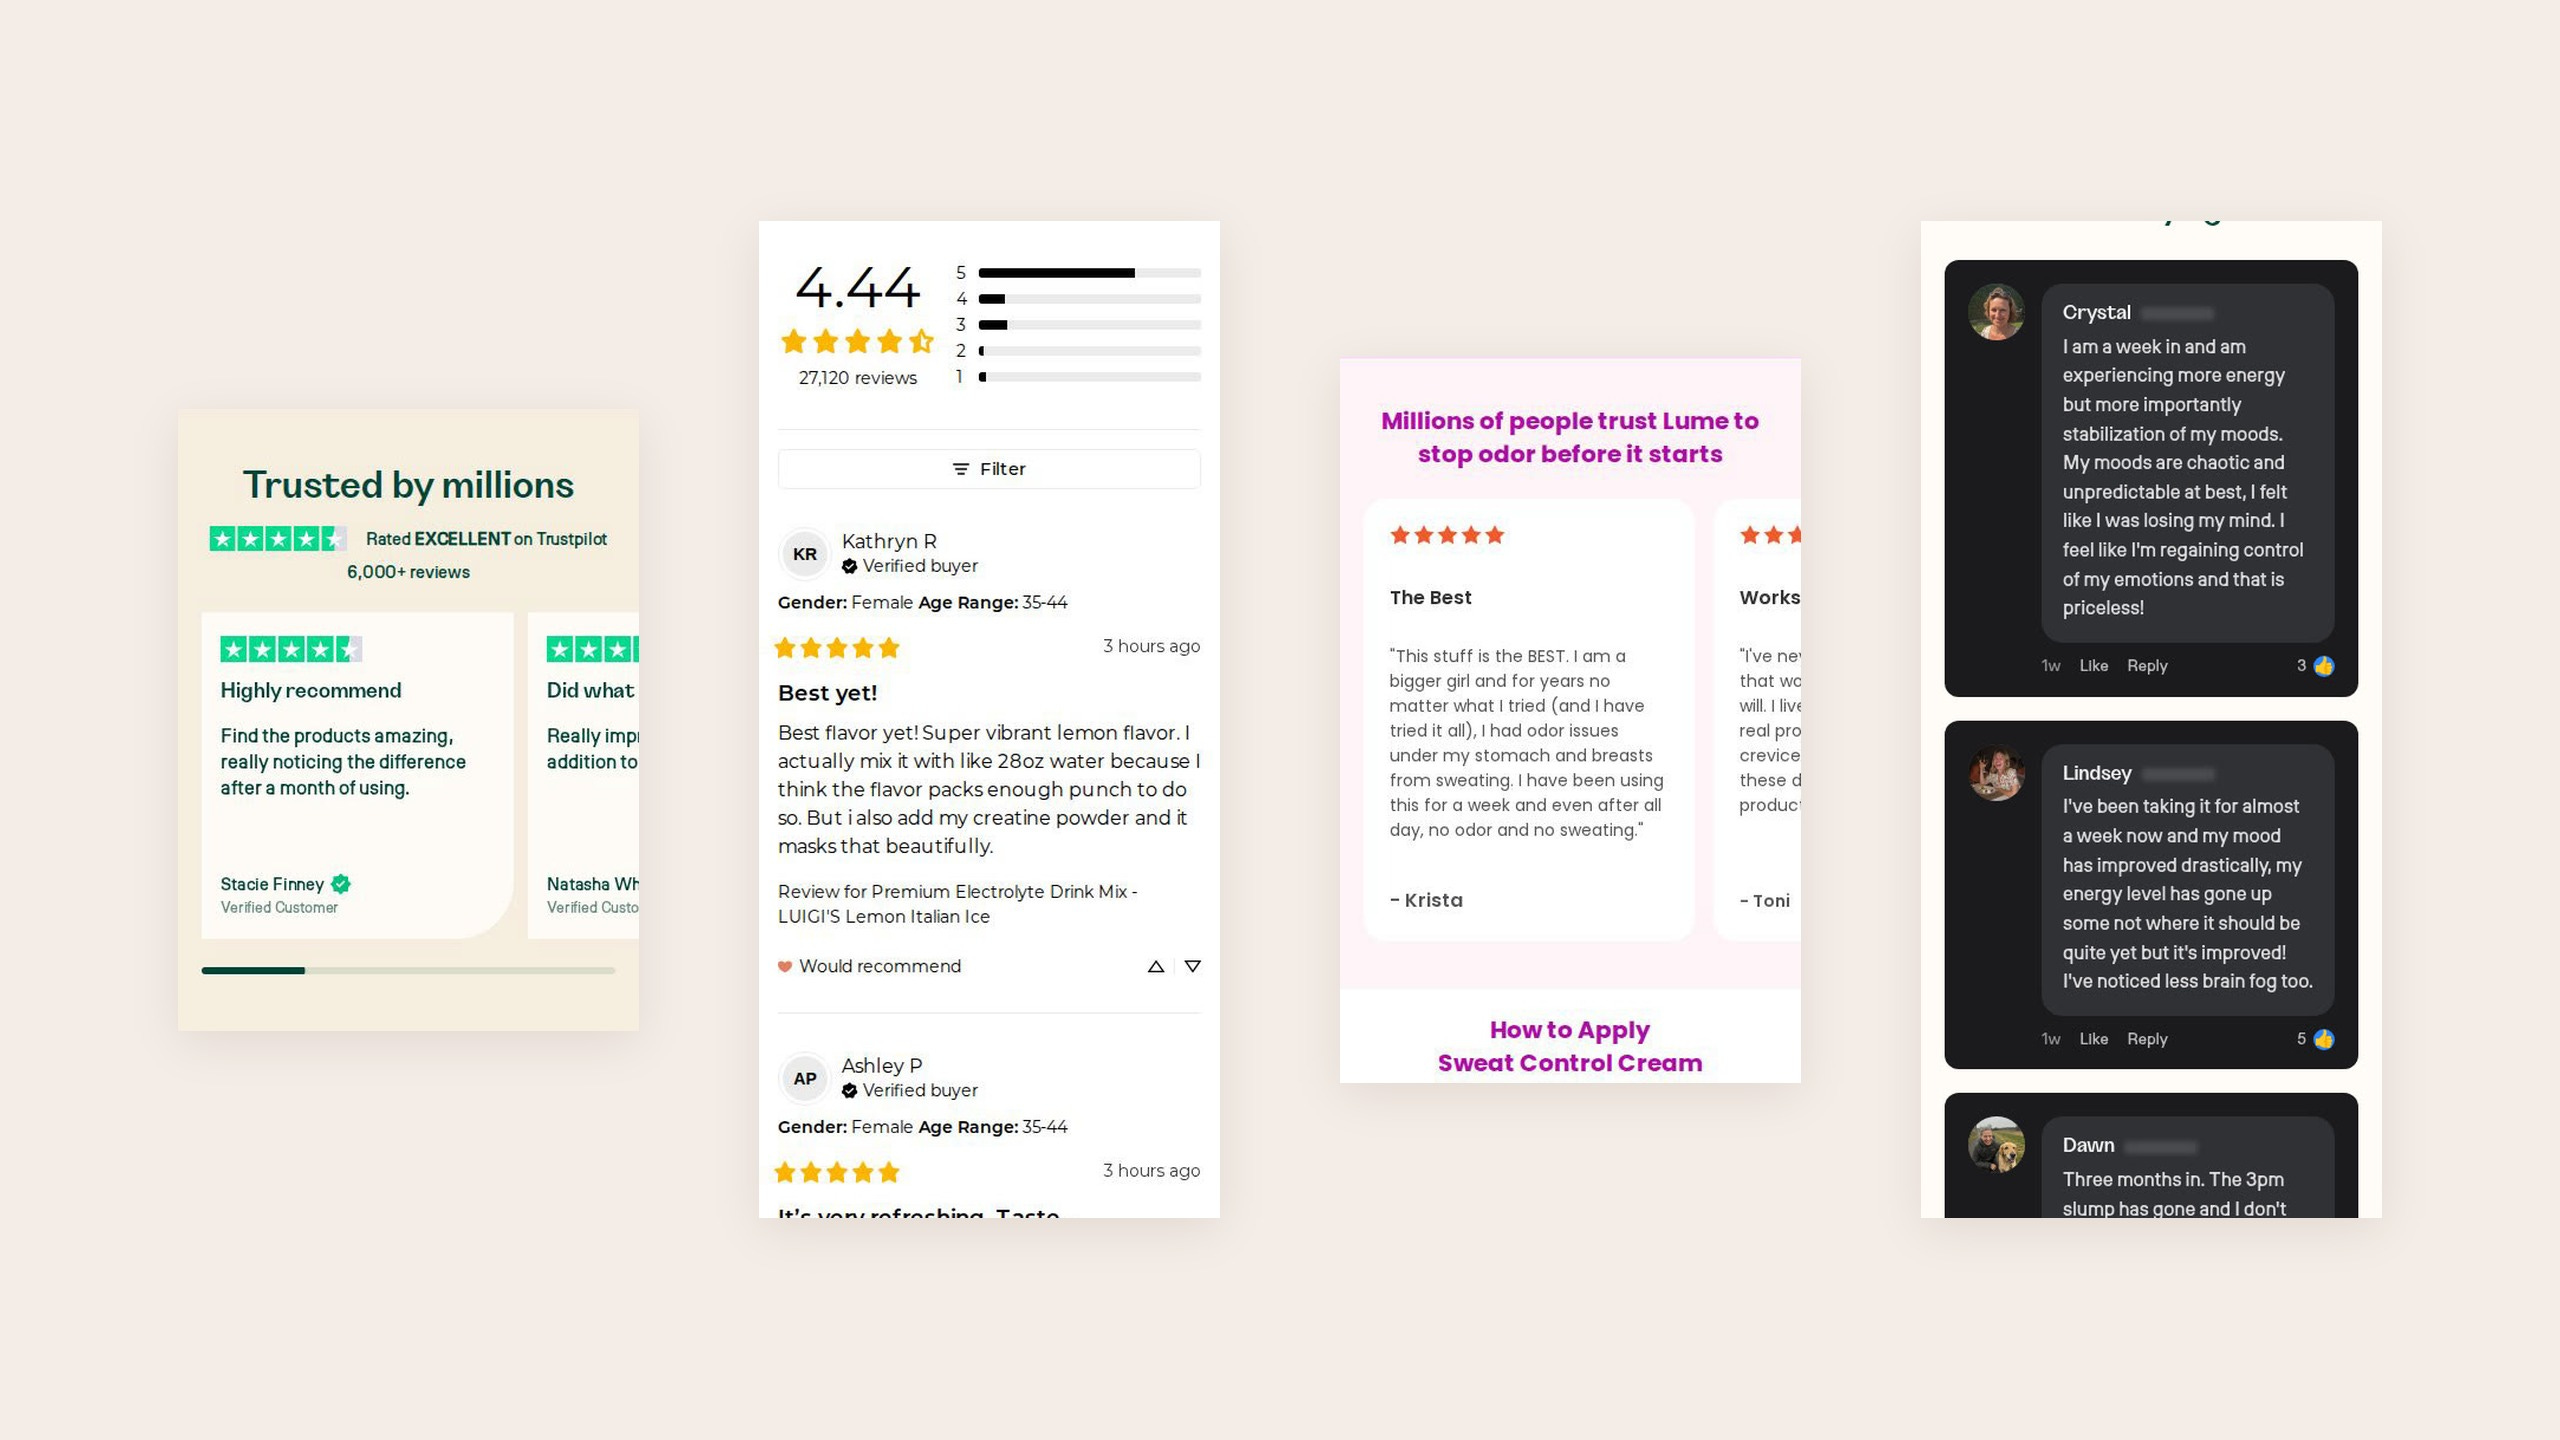
While the inclusion of product explainers feature more frequently, one area that bucks the trend is reviews.
63% of the Best LPs feature them, but that’s lower than the three-quarters of pages they feature in
They still feature the majority of the time, and so you’re likely to be safer by including them – but it begs the question as to why they are less likely to appear in the most frequent tests.
5. The sections you’ll want to include
With all this in mind then, here are the sections and their frequency of inclusion amongst the Best LPs.
Hero – 86%
Benefits – 54%
Buy box – 34%
Benefit detail – 31%
How it works – 29%
Comparison – 29%
Offer – 45%
Reviews – 63%
FAQ – 51%
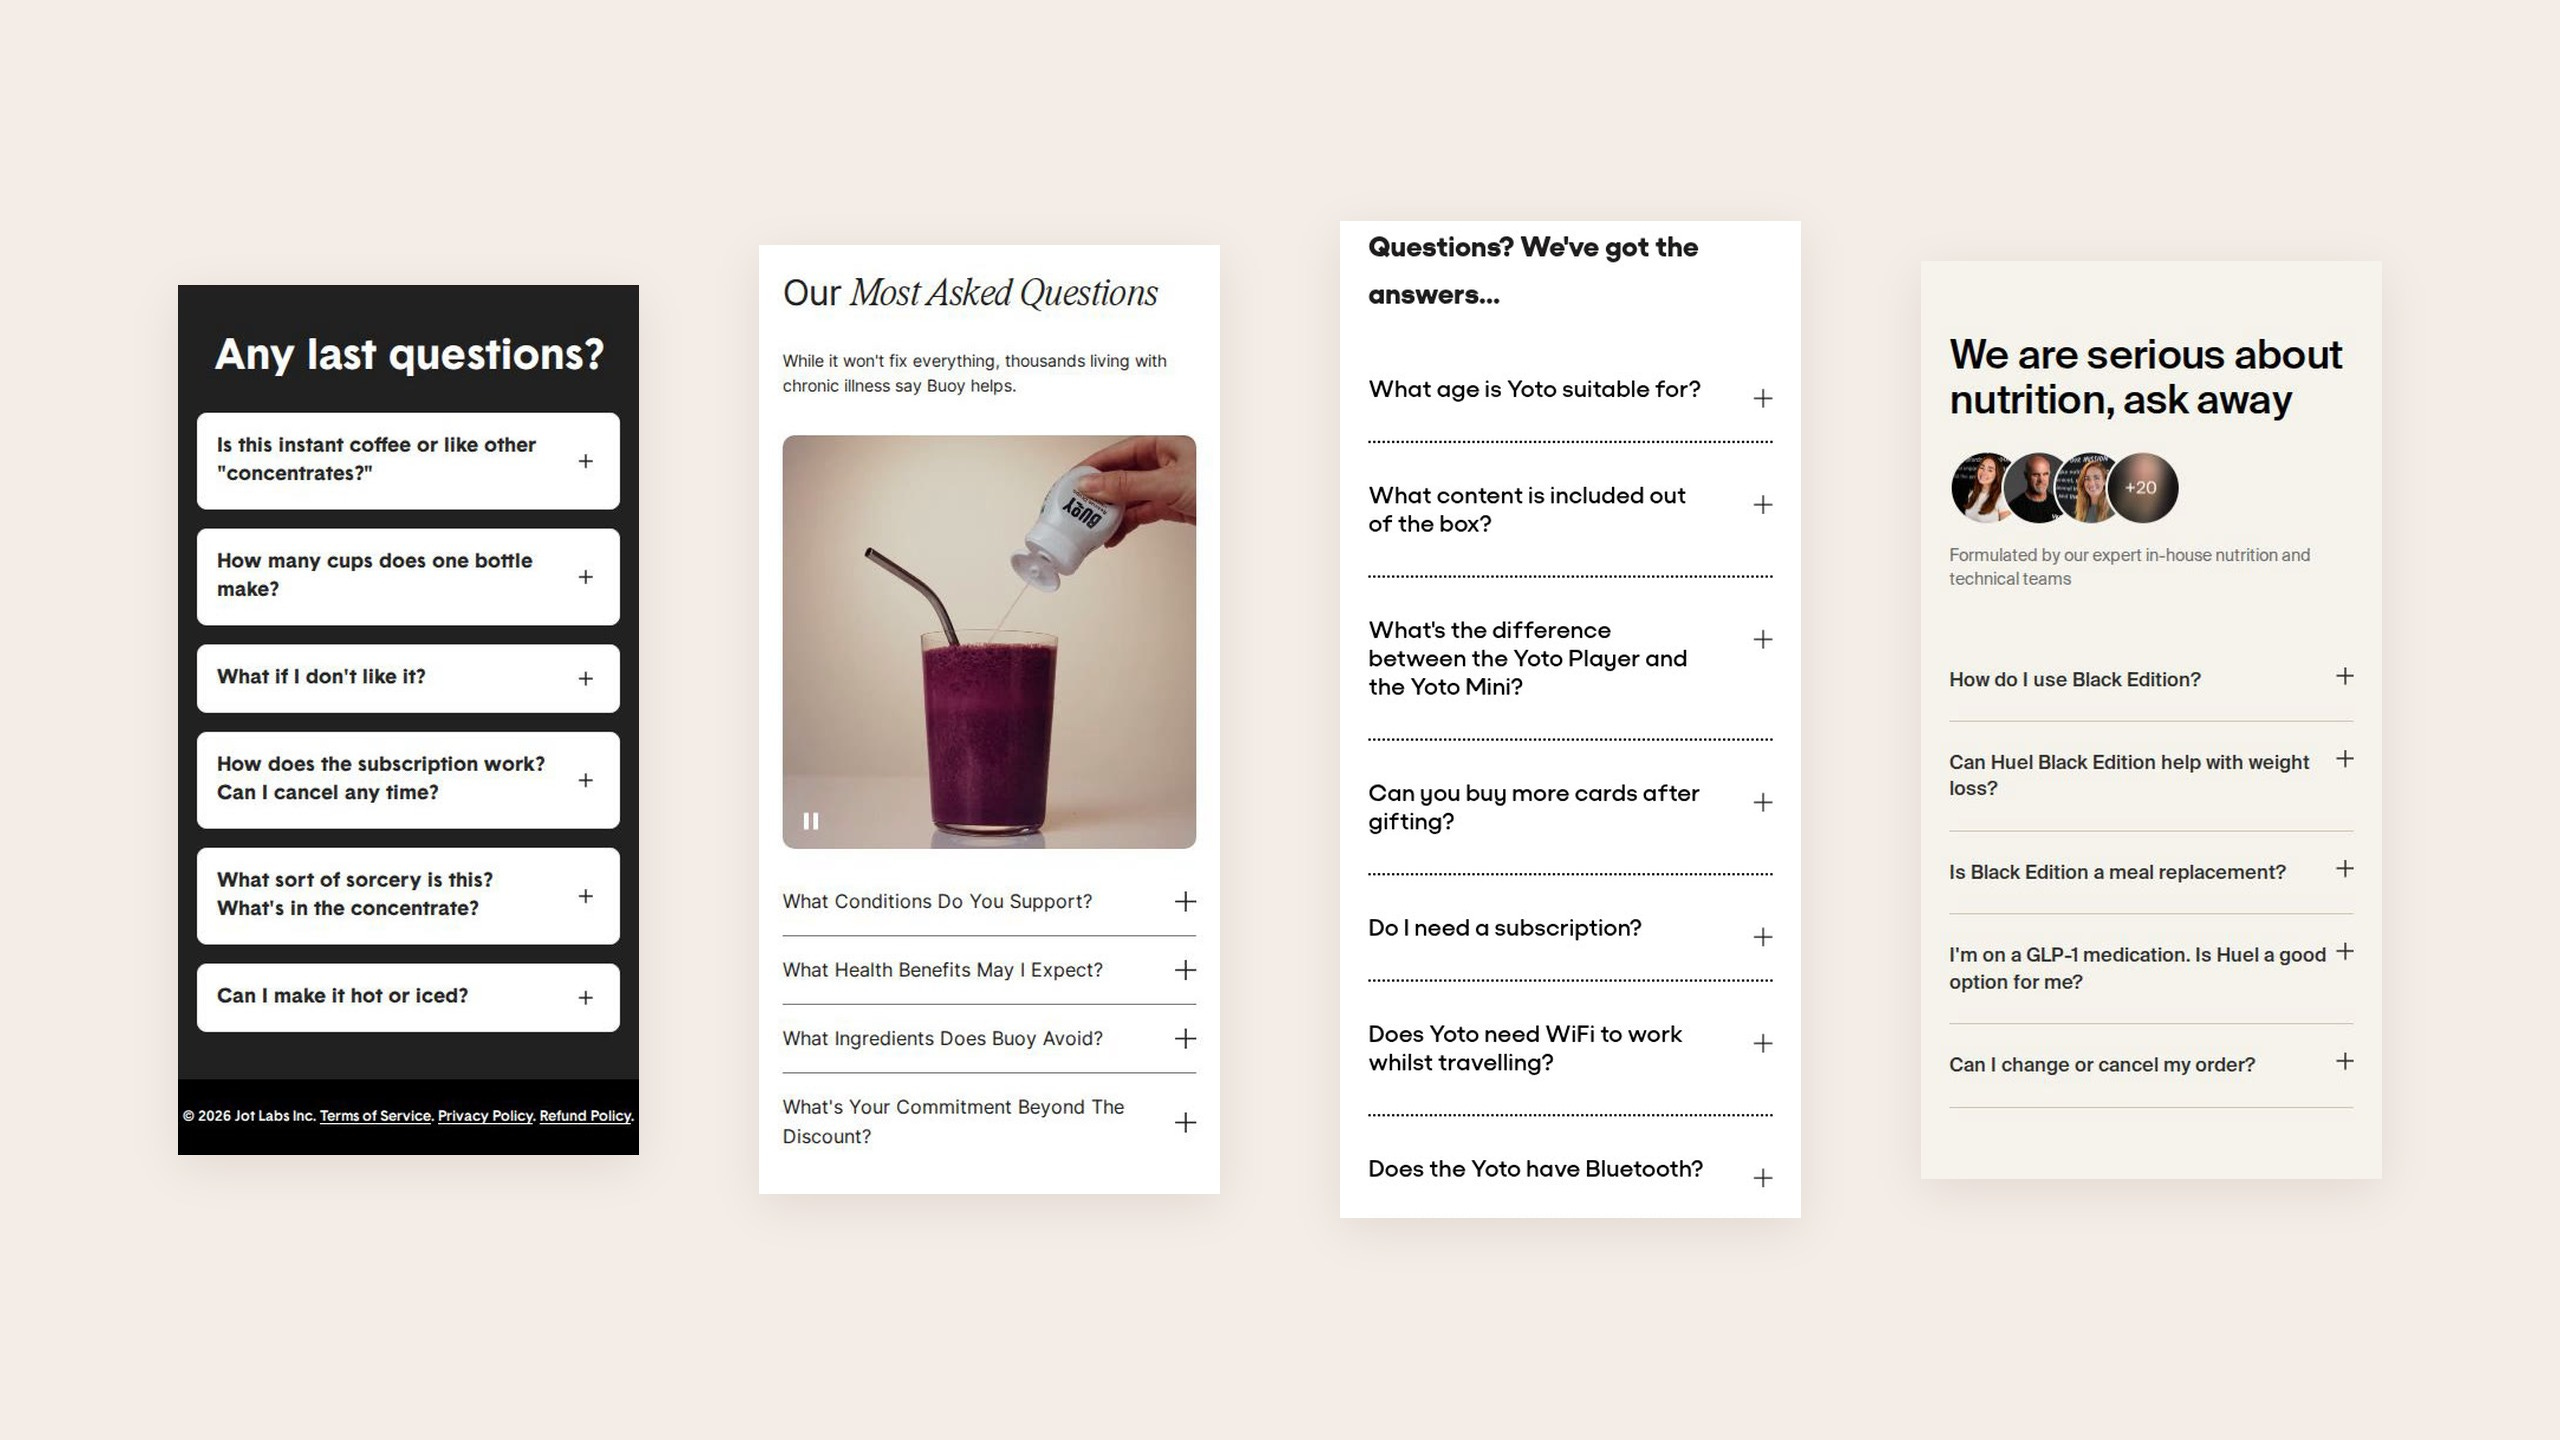
A few of our favourite landing pages
Having looked at hundreds of these in recent months, here are a few of our favourite landing pages. Check out our five favourites here:
These previews are only available to subscribers.
Start with a best practice LP today
There is no one-size fits all approach, and even starting with those most common sections of the Best LPs, there’s still a huge amount of variety to be found within them.
But, we find it useful – especially for brands who have yet to testing landing pages – to begin with some of these best practices.
What we’ve not spoken about today is the messaging that feeds into your landing pages. For that, we recommend mirroring the same approach you use with ad creative:
Interview fresh customers to understand their problems and psychology
Write a landing page for that specific person and their problems
Build ads around it
Test the entire user journey
If you need support on landing pages and want to see what an insights & research-led approach to CRO and UX can do to your conversion rate, then drop me a line.
I’m the founder of Ballpoint. We’re a technology and AI-driven growth agency that scales brands through creative and paid social. If you are spending £30k per month and want to scale to 10x that over the next two years – without losing any margin – then get in touch.