

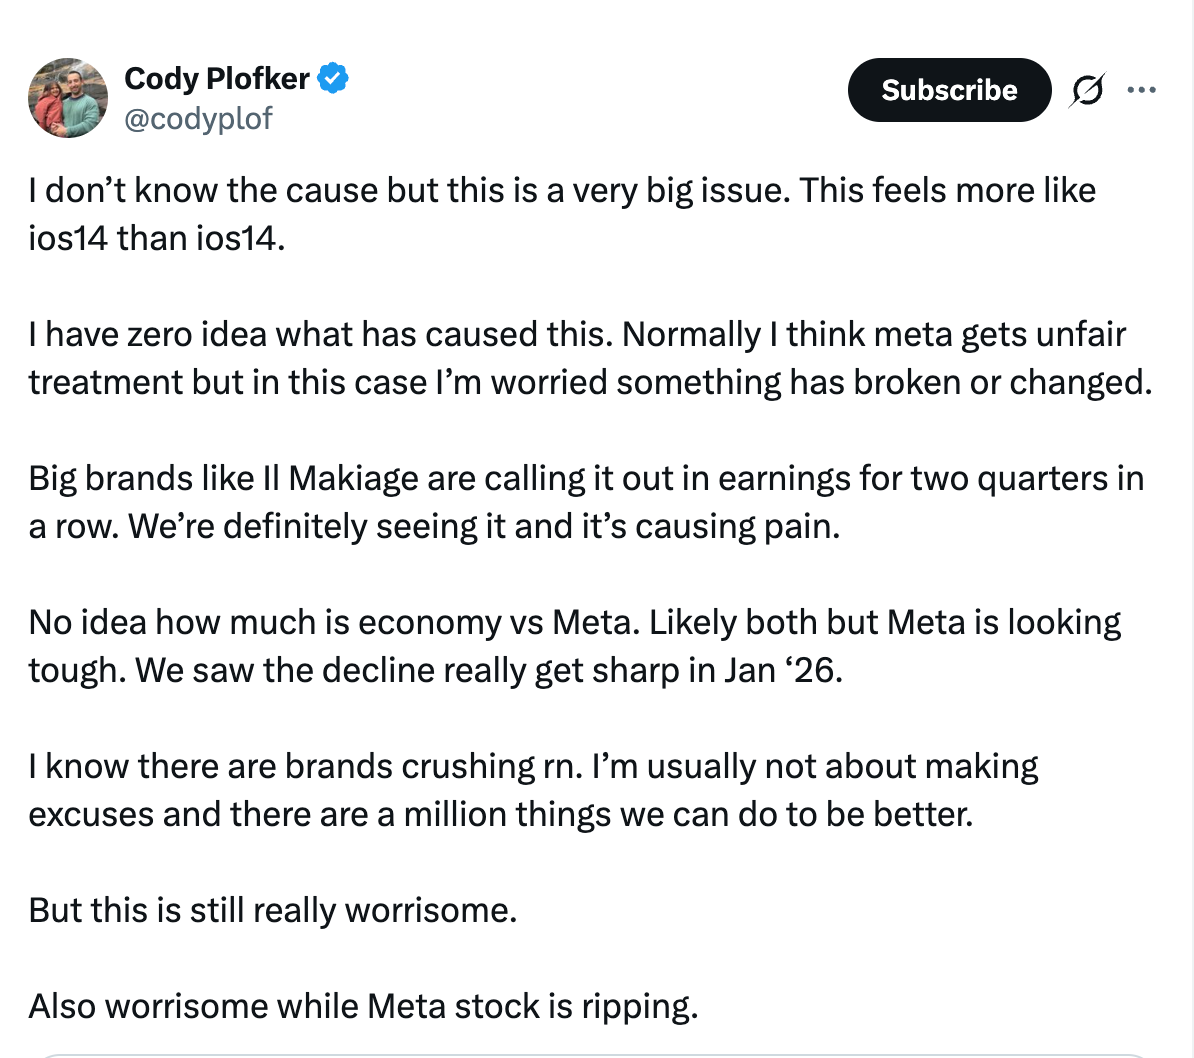
Last Friday, Jones Road Beauty CEO Cody Plofker tweeted about Meta performance this year.
Jones Road Beauty spend an estimated eight-figures a year on Meta, and anyone who follows Cody will know they are on it when it comes to marketing evaluation.
Cody references Il Makiage, the brand who skyrocketed to $800m of revenue with a heavy weighting thanks to Meta.
Il Makiage have seen an 83% increase in year over year H1 CAC compared to a typical rise of 15%.
In Il Makiage’s June earnings report, they say:
“We believe this data supports the view that the CPA dislocation is technical in nature, rather than driven by brand health or market saturation.”
Il Makiage state that this is happening evenly across their key markets of US, Canada, UK, Australia, and Israel.
They pre-warned this in the February earnings report, stating:
“We experienced a dislocation in our account with our largest advertising partner that we believe was driven by algorithm changes, which diverted us to lower quality auctions at abnormally high costs.”
Il Makiage spent an estimated $145m on Meta advertising in 2025.
These are two dominant, performance-focused, Meta-heavy brands who are deeply expert at marketing these channels. And importantly, they are not the people who jump to blame Meta at the first sign of poor performance.
This conversation has been growing in recent weeks. Northbeam, who provide marketing measurement services to high spending brands, have been reporting similarly over the last few weeks.
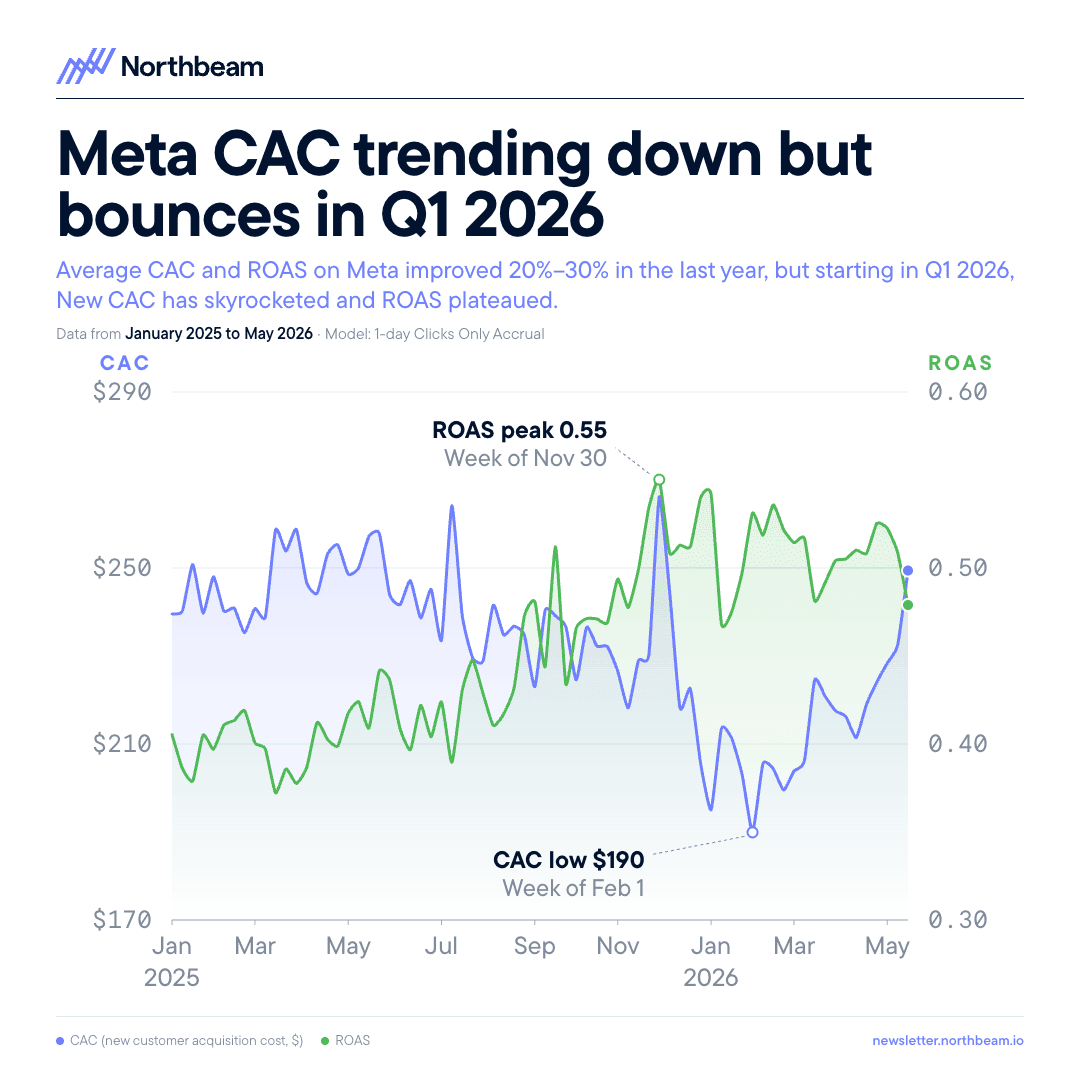
Northbeam’s data is across “billions” of ad spend and they have “950+” advertisers. Let’s say it’s $3bn of ad spend, it means the average advertiser is spending $3.2m/year as a Northbeam customer. The media is likely higher, but whatever the story – we can assume that these are some of the world’s biggest advertisers on Meta.
CAC hit a low in the first week of Feb of $190 and has grown month over month since then to $250 today. Meanwhile, ROAS is trending downwards.
Open up X and these anecdotal reports following this pattern are everywhere:


In WhatsApp groups everywhere I’ve heard the same questions asked since the beginning of the year: “is meta performance bad for you too?”
When we wrote about the shift in consumer behaviour in January, we shared two sides of the coin. Yes we’d seen some categories down, but others were doing well. And while January in the UK felt damp, the US was still firing.
What we’re seeing in our data
The Northbeam report inspired me to go do the same and look back at our client data over last 18 months. Now, our dataset is considerably smaller than Northbeam’s, but I wanted to dig in to see what patterns were that we could see.
Headline stat:
For the clients we've managed the last 18 months, 2026 CPA increases are 13% YTD vs 9% YTD same point last year.
That means there’s been 44% higher CPA growth this year than the year prior. But, for all clients we now have access to the 2026 data is much more extreme – and there is a bigger negative trend.
Now why the gap? There’s a few variables, caveats and notes we should add for context behind the numbers.
We typically work with brands attempting aggressive spend growth
A typical client trajectory is:
Year 1: £30k/month spend
Year 2: £80-120k/month spend
Year 3: £200-300k/month spend
Every marketing channel suffers diminishing returns, and so it’s expected for their to be some CPA increase factored into spend increases of that nature. As a result, all things held equal, you’d expect CPA increases each year. In practice, this happens less than you expect given we only scale when the opportunity is there it means the aggressive scale clients typically have more stability than not, but it is still a factor.
We have a huge CPA range with clients
We have a broad range of CPAs across clients from £10-£250, and so using averaged numbers didn’t feel overly useful here. Instead, I prefer the index version which we indexed to Jan 2025 performance.
Most clients come to us because their CPAs are too high and need them fixing
Result here is we might have had a client join us in February of this year, who had a hugely volatile 2025, and now we’re into May-June, that’s starting to balance out as we learn and scale. But it means that the dataset has a huge external factor that isn’t spend, seasonality, macroeconomics – which is us.
Fixing a growth ceiling takes time and usually leads to volatility at the start
As with above, new client relationships usually come with higher CPA in the short term while we increase testing velocity and that creates instability.
Our dataset is naturally skewed by those who we’re more likely to have won recently, which means some of those increases this year are owing to this.
Often there are attribution issues, and we ultimately measure off-platform
Two clients in our dataset we switched from 7 day click, 1 day view, to incremental attribution when we started working together. This had a 40% and 82% increase in platform CPA, though an improvement to off-platform incremental CPA.
And so ultimately we’ve reset the the targets on Meta, but that isn’t accounted for in this data.
All of these things together indicate to take this data, as you do Northbeam’s with a pinch of salt.
Thoughts on our data
In short I summarise this as:
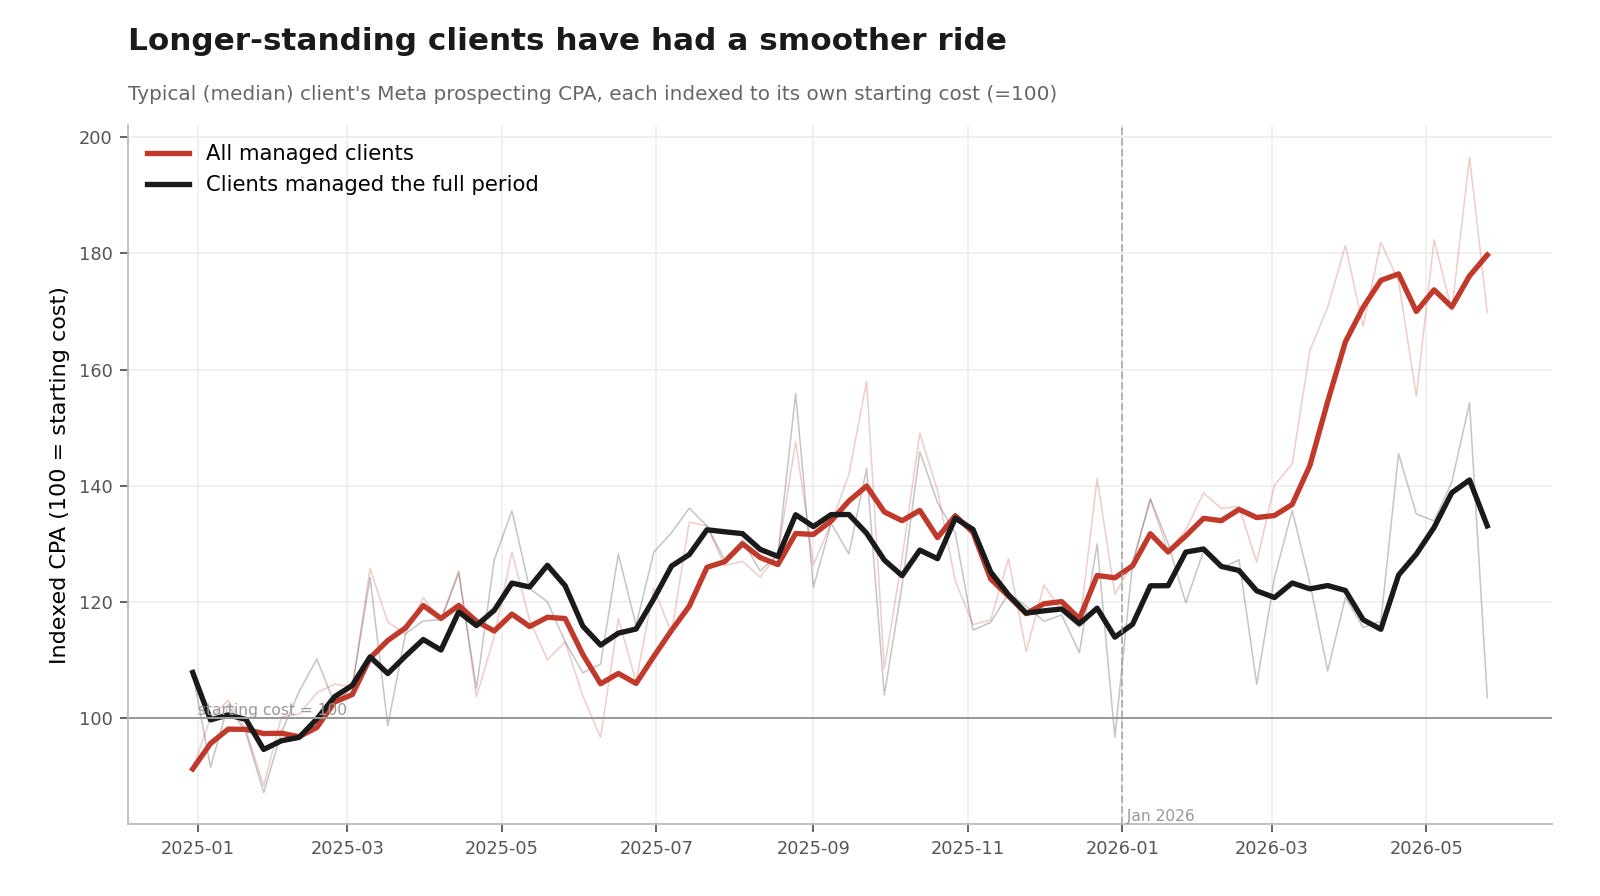
For clients we’ve managed the whole time, we saw a:
9% increase in CPA from Jan 2025 → May 2026
13% increase in CPA from Jan 2026 → May 2026.
All clients that figure goes to 38% for total base.
For the ones we’ve worked with the entire data range, it certainly feels like there’s faster CPA growth than in previous years.
But it’s not the 83% that Il Makiage have seen – but a 44% one instead. That’s still a pretty substantial figure even when the absolute percentage points figure is less.
We’ve been fortunate that for our longest standing clients, we’ve been able to counteract and ‘beat the market’, which we put down to:
better retention data and measurement, and therefore a stronger ability to balance spend and incrementality,
1000s+ of insights for each of those clients meaning we can produce creative win rates 50-100% higher than typical,
more data in Meta and more spend, meaning more stability.
For most clients we work with there is still gains to be made beating the market and so we remain optimistic – that said, the conditions do seem to be worse.
More advertising dollars spent on Meta
This was an edit after the original post went out.
As Jan Deruyck points out in the comments, at least some of this story will be the fact there is more competition in platform.
In Q1 this year Meta saw:
Ad revenue grew 33%
Daily active users grew 4%1
By that token, the CPA changes we’re seeing are pretty minor. In our data we measured Jan → May year over year rather than Q1 to Q1, but a 13% increase is significantly below that 33% increase otherwise seen.
What’s driving the performance change?
This is where we get into unknowns. Sceptics point at Meta, and indeed Il Makiage and Cody Pfloker have both publicly raised those concerns themselves.
But we are also in a macro environment that has significant issues:
AI is causing middle class job uncertainty and/or loss
War in the Middle East is pushing up prices for many goods which we have yet to feel the full downstream impact of
Tariffs are impacting import/export globally
UK mortgage costs ballooning
The old age question is always: is it my marketing or is it the market? I think what’s clear is that there is some market condition driving things at the moment. To what extent that is platform & technical vs macro and economic, I don’t have enough visibility or data to answer.
What do we do with this information?
Hopefully it provides some solace. If you’re seeing more CPA change than expected, understand that some of the smartest large advertisers in the world are seeing the same thing.
But more importantly, it means our job is harder. For most brands I know, we’re already at the efficiency threshold when things make sense. Marginal CM is difficult to find, and a 15% increase to CPA year over year compared to a 9% one is substantial.
The work gets harder, you need more insights, you need more experiments, and you need faster feedback loops.
Whether this is the worst Meta performance year on record is still to be seen. But right now it looks like it’s in a tough phase. Hang in there, get experimenting, and as ever if you’re not happy with your current level of experimentation – then get in touch.
I’m the founder of Ballpoint. We’re a growth agency specialising in creative-driven performance marketing. In March 2026, we made the pivot to become AI native. For the clients we work with for more than a year, we typically triple their spend while maintaining CPA. If that’s something you want for your brand, then get in touch. Just be warned, we’re going to tell you how to sell.
https://investor.atmeta.com/investor-news/press-release-details/2026/Meta-Reports-First-Quarter-2026-Results/default.aspx
Every year I've been in DTC people shout it's the worst year. I came to this industry when iOS14 hit and have never seen anyone happy. At this point I don't even know if it's Meta or just the industry complaining. All jokes aside, isn't this to be expected as more and more businesses congest the pipes? The Meta ads product looks like a legacy 2010 product that has been updated many times causing bugs. Add in new AI models, algo changes, learning etc. Next the immense creative volume that is also added every day... I mean how does one expect CACs to go down? The full funnel marketing approach you preached seems like the way to go for all brands. Having an alternative strategy to meta to acquire too.